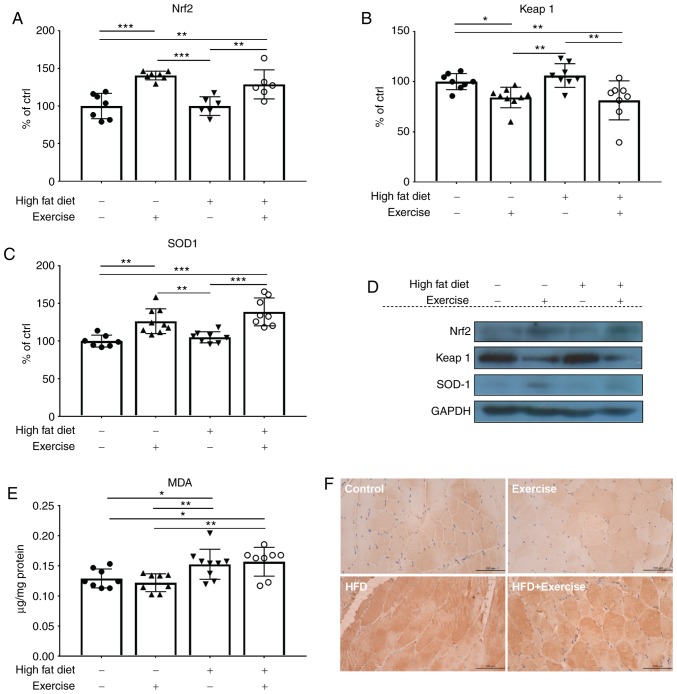
Figure 5.
Protein expression levels of (A) Nrf2, (B) Keap1 and (C) SOD1 were examined using western blot analysis. (D) Representative western blot analysis gel using samples from in the skeletal muscles of the control, exercise, HFD and HFD + exercise groups. Western blot analysis data are presented as mean ± standard deviation. *P<0.05, **P<0.01 and ***P<0.001. The results are presented as relative to the control group, which was arbitrarily assigned a value of 100. (E) The content of oxidative stress marker MDA is presented as µg/mg protein. (F) Representative images of immunohistochemical staining of nitrosative stress marker inducible nitric oxide synthase (magnification, ×400). Nrf2, nuclear factor erythroid 2-related factor 2; Keap1, kelch-like ECH-associated protein 1; SOD1, superoxide dismutase [Cu-Zn]; HFD, high-fat diet; MDA, malondialdehyde.

