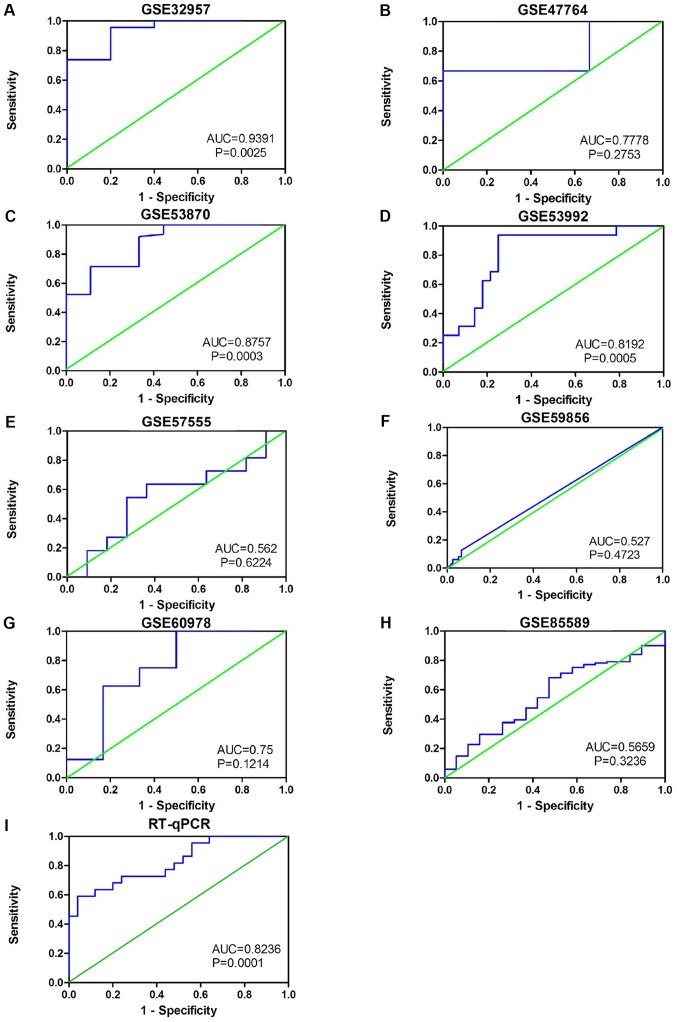
Figure 4.
Receiver operating characteristic curves based on Gene Expression Omnibus datasets and in-house RT-qPCR data. (A) GSE32957, (B) GSE47764, (C) GSE53870, (D) GSE53992, (E) GSE57555, (F) GSE59856, (G) GSE60978 and (H) GSE85589 data. (I) In-house RT-qPCR analysis data. AUC, area under the curve; RT-qPCR, reverse transcription-quantitative PCR.

