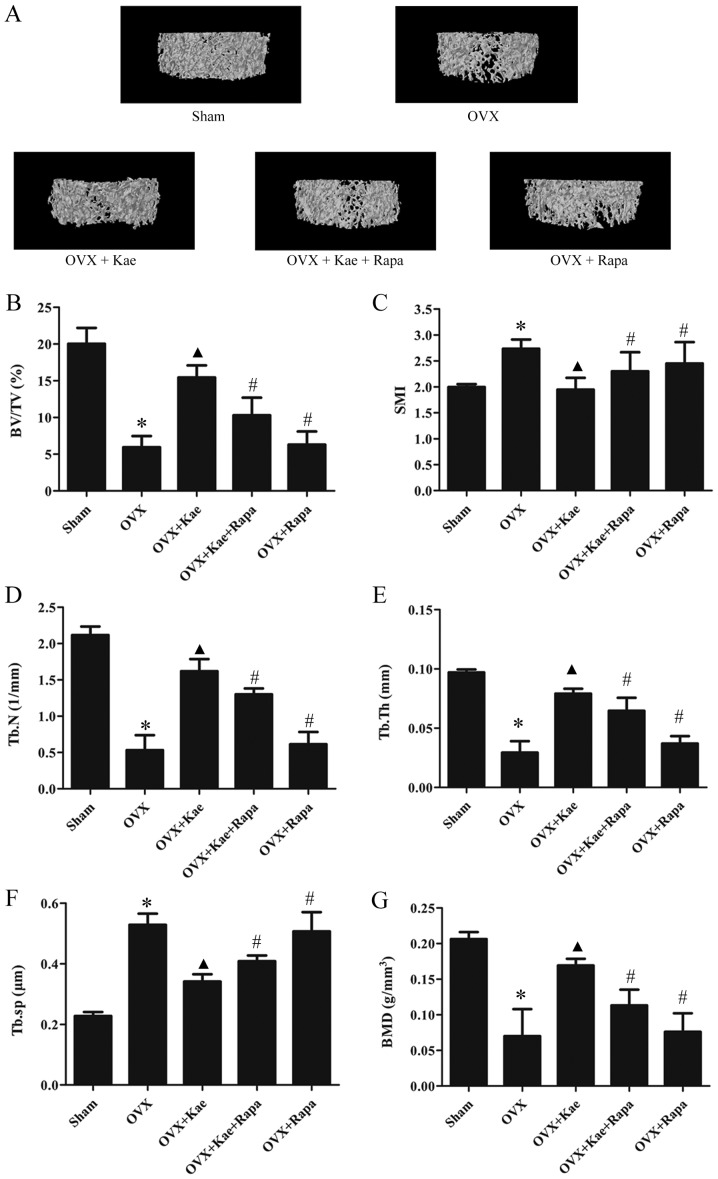
Figure 2.
Effects of Kae on bone microarchitecture in rats. (A) Representative trabecular bone microarchitecture of the femoral metaphysis for each group, obtained from micro-CT images. Quantification of various parameters of bone microarchitecture for each group: (B) BV/TV, (C) SMI, (D) Tb.N, (E) Tb.Th, and (F) Tb.Sp. (G) BMD parameters measured using micro-CT in each group. The data are expressed as the mean ± SEM (n=6). *P<0.05 vs. control group; ▲P<0.05 vs. OVX group; #P<0.05 vs. OVX + Kae group. Kae, kaempferol; micro-CT, micro-computed tomography; BV/TV, bone volume/tissue volume; Tb.N, trabecular number; Tb.Sp, trabecular separation, Tb.Th, trabecular thickness; SMI, structure model index; BMD, bone mineral density; Rapa, rapamycin; OVX, ovariectomized.

