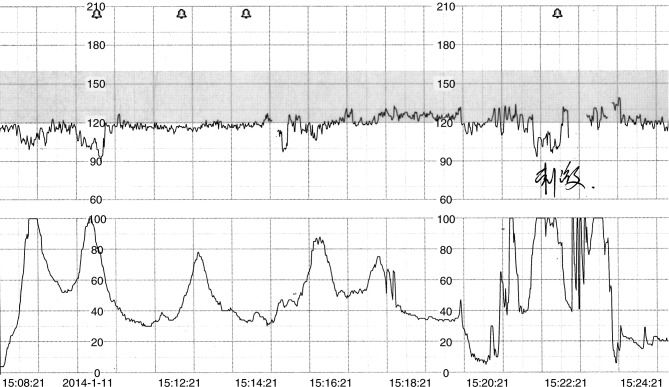
Figure 1.
Cardiotocogram obtained during the delivery of patient 1. The upper curve recorded fetal heart rate while the lower curve recorded uterine contractions. The two decelerations on the left, with the lowest rate of 90 beats per minute, were relieved spontaneously when uterine contractions ceased. The deceleration on the right was caused by vaginal examination.

