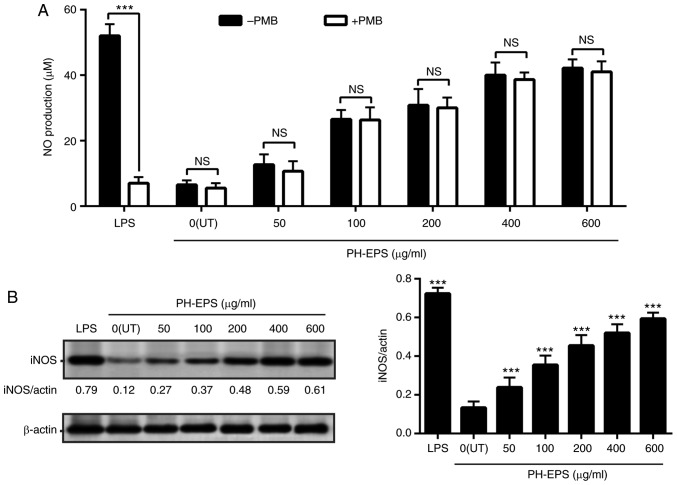
Figure 2.
Effect of PH-EPS on iNOS expression and NO production. RAW 264.7 cells were treated with LPS (1 µg/ml) or the indicated dose of PH-EPS for 1 day. (A) NO levels in the supernatant were measured. ***P<0.001, with comparisons indicated by brackets. (B) iNOS protein expression was analyzed by western blotting and the protein ratios were calculated. ***P<0.001 vs. UT group. Data are expressed as mean ± standard deviation of triplicate experiments. PH-EPS, exopolysaccharides derived from the fungus Paecilomyces lilacinus PH0016; iNOS, inducible NO synthase; NO, nitric oxide; LPS, lipopolysaccharide; UT, untreated; PMB, polymyxin B; NS, not significant.

