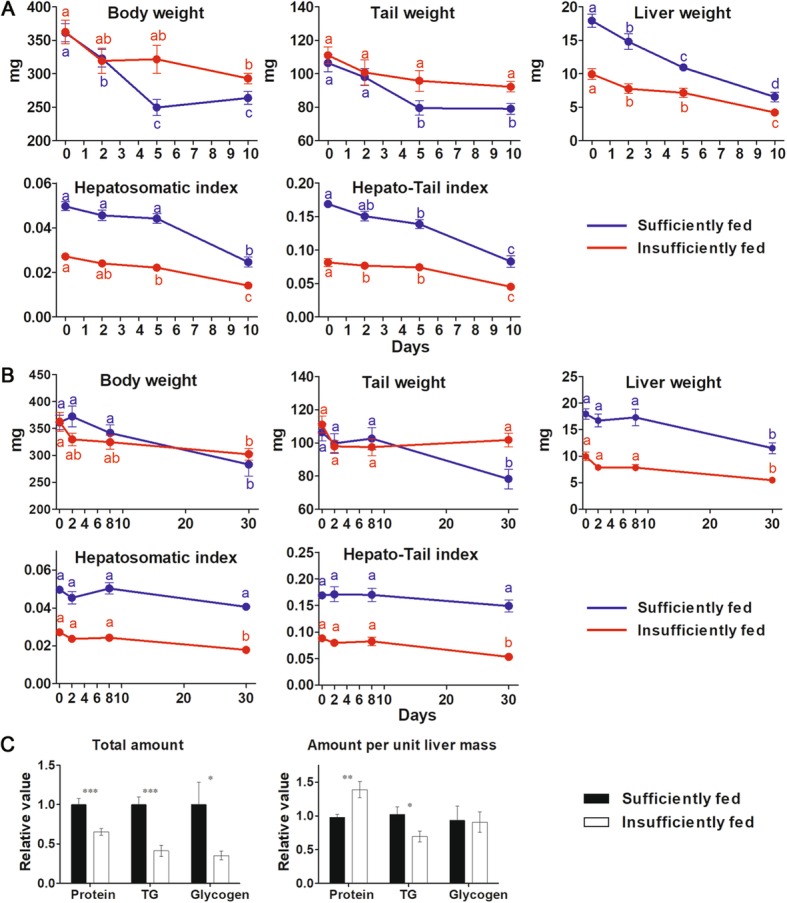
Fig. 10.

Different responses of sufficiently and insufficiently fed tadpoles to starvation. a Variation of body indexes during starvation at 20 °C. b Variation of body indexes during starvation at 8 °C. Each value represents the mean ± standard error (n = 6-13). Different letters indicate significant differences between values (p < 0.05), as shown by the Student–Newman–Keuls post hoc test after one-way ANOVA. c Comparison of the absolute and relative content of hepatic reserves between sufficiently and insufficiently fed tadpoles. Each column represents mean ± SE (n = 5-7), ***: p < 0.001, **: p < 0.01, *: p < 0.05
