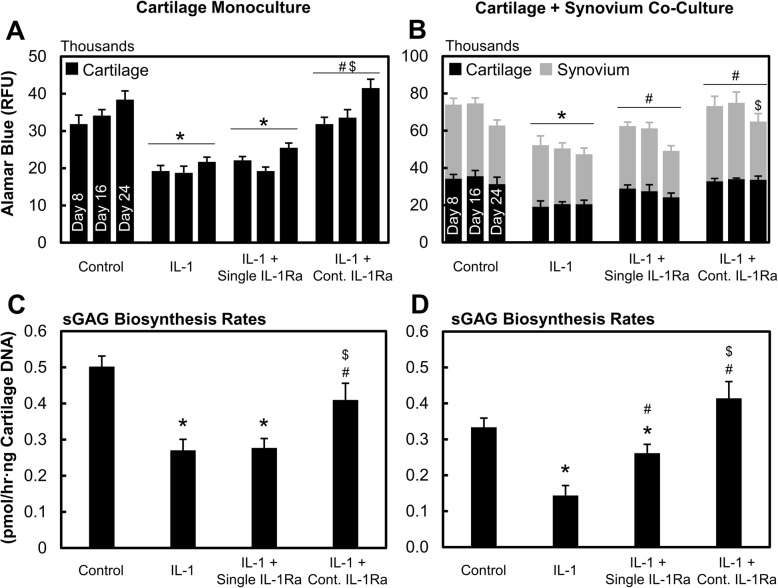
Fig. 3.
IL-1α-treated cultures administered with either a single or continuous (Cont.) dose of IL-1Ra. Cell metabolism of individual tissues in a cartilage monoculture and b cartilage + synovium co-culture. Rate of sGAG biosynthesis in cartilage tissue at day 16 in c cartilage monoculture and d cartilage + synovium co-culture. Data is presented as mean ± 95% confidence interval. * vs control, # vs IL-1, $ vs single-dose IL-1Ra, ^ vs corresponding cartilage monoculture (p < 0.05). Statistical markers are color coordinated with all bars

