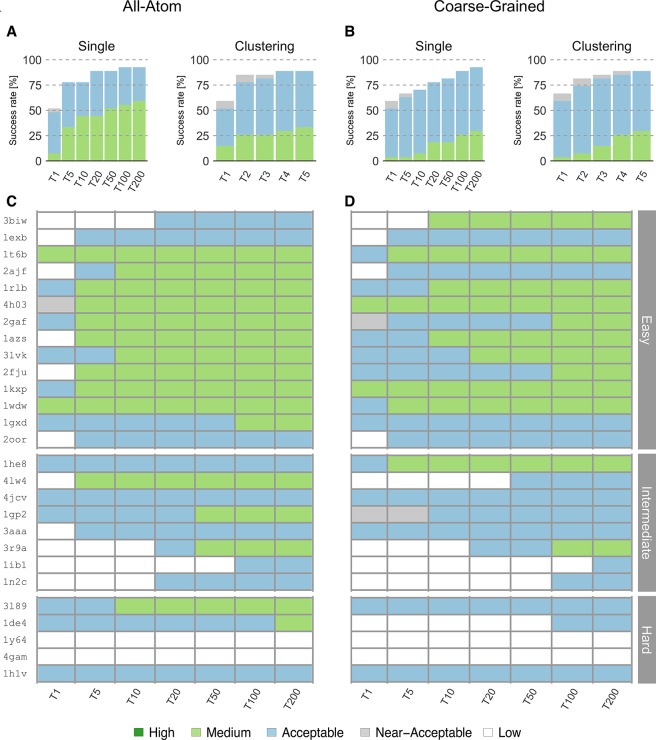
Figure 2.
Performance of the all-atom and coarse-grained protocols in HADDOCK on the 27 largest complexes of the docking benchmark 5. (A) Overall success rates (%) of the all-atom protocol on ranking single models (Single) or clusters (Clustering) as a function of the number of models/clusters considered. (B) Same as (A) but for the coarse-grained protocol. (C) and (D) Quality of the docking models for all 27 cases as a function of the number of models considered. The complexes are ordered by increasing degree of difficulty (from top to bottom) for both all-atom and CG docking runs. The color coding indicates the quality of the docked models.

