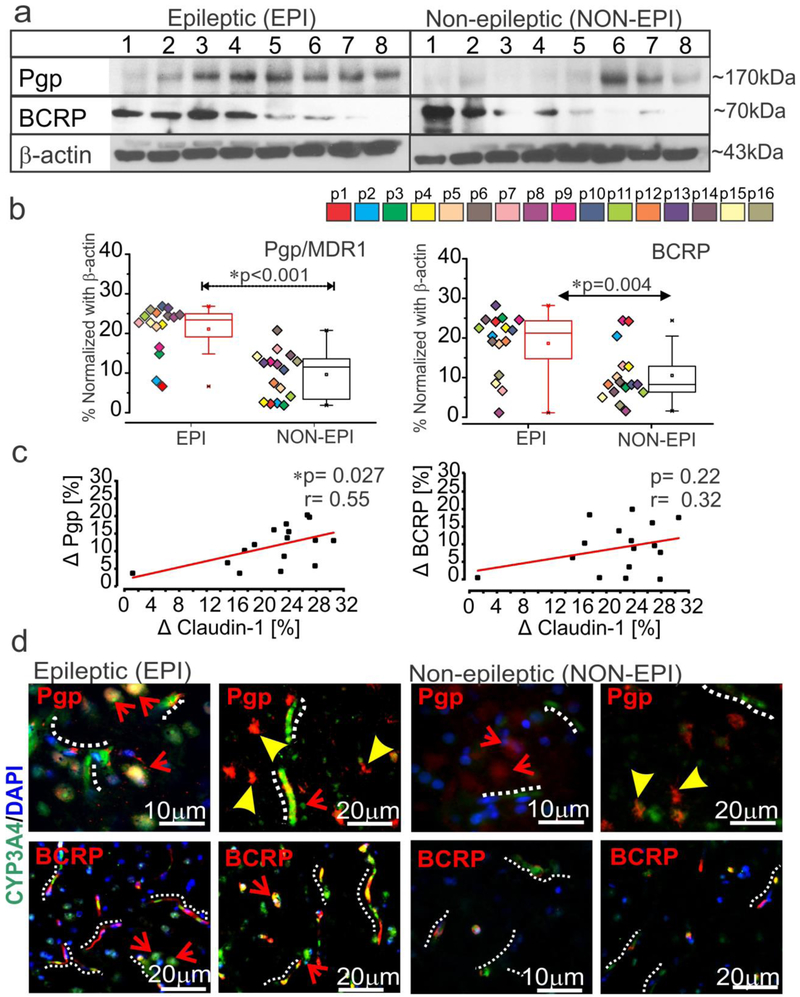
Fig. 3.
Elevated drug efflux transporters co-localize with CYP3A4 and correlate with claudin-1 expression in the epileptic brain. (a-b) Analysis of the brain tissue showing (a) representative western blots (n = 8 subjects) and densitometric quantification normalized with β-actin (b). A significant increase was noted in P-gp (*p < 0.001) and BCRP (*p = 0.004) in EPI vs. NON-EPI region (n = 16 subjects). Non-parametric analysis for paired samples Wilcoxon signed rank test was performed for direct comparison of two population of data set obtained. Results are expressed as mean ± SEM. (c) A positive correlation between the differences between EPI and NON-EPI claudin-1 expression and that of the drug efflux transporter P-gp (*p = 0.027, r = 0.55) was observed within the specimens analyzed (n = 16) by one-way ANOVA. The association between claudin-1 and BCRP (p = 0.22, r = 0.32) failed statistical significance. The percent difference in protein expression between EPI and NON-EPI regions is indicated by Δ. (d) Representative immunostaining of the brain sections show increased CYP3A4 and P-gp/BCRP in the micro-capillaries and neurons of EPI compared to NON-EPI regions (n = 6, in triplicates). Note: micro-capillaries are indicated with dotted white-lines; astrocytes with arrowheads and neurons with arrows. Nuclei are stained with DAPI.

