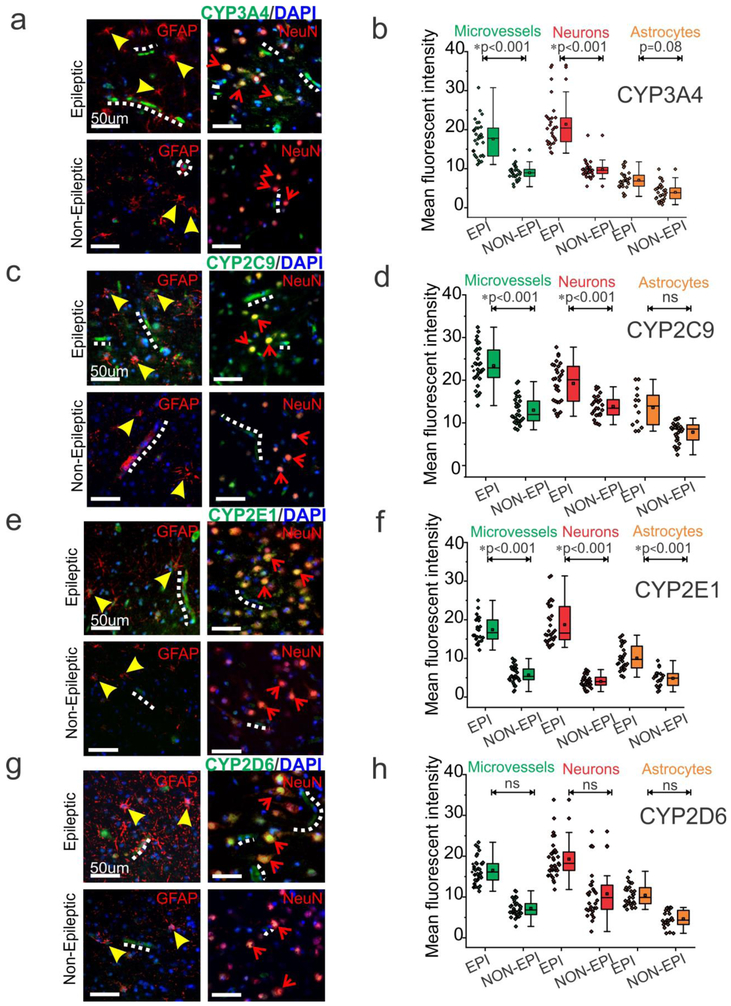
Fig. 4.
CYP distribution in the endothelial cells, neurons and astrocytes in epileptic brain. (a, c, e, g) Representative images of resected tissues shows increased expression of CYP in the EPI brain BBB interface and neurons compared to NON-EPI brain tissue (n = 6, in triplicates). (b, d, f, h) Quantification of immunohistochemistry indicating increased CYP isoform expression in EPI compared to NON-EPI tissue. Elevated CYP3A4 levels were found in the microvessels (*p < 0.001), neurons (*p < 0.001), and minimally in astrocytes (p = 0.08). Similarly, CYP2C9 is overexpressed in the microvessels (*p < 0.001) and neurons (*p < 0.001); and CYP2E1 in the microvessels (*p < 0.001), neurons (*p < 0.001), and astrocytes (*p < 0.001). However, CYP2D6 showed non-significant (ns) difference in these cell types among EPI and NON-EPI brain regions. Non-parametric analysis for paired samples Wilcoxon signed rank test was performed for direct comparison of two population of data set obtained. Results are expressed as mean ± SEM. Note: micro-capillaries are indicated with dotted white-lines; astrocytes with arrowheads and neurons with arrows. Nuclei are stained with DAPI.

