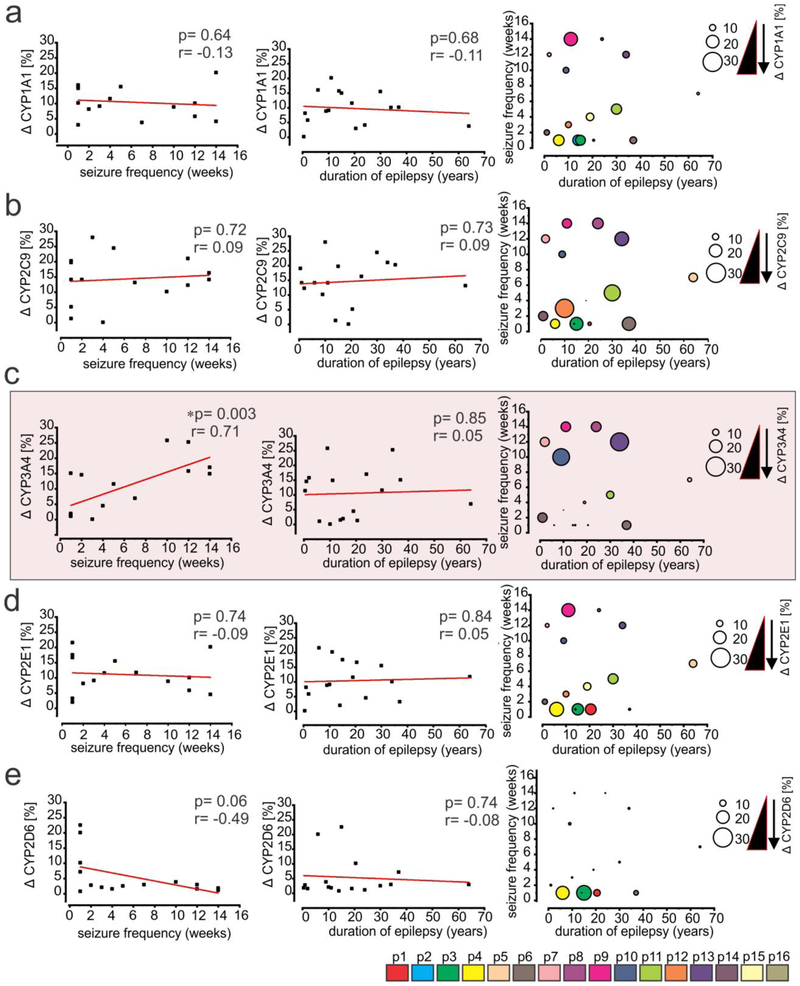
Fig. 6.
CYP3A4 expression in the epileptic brain correlates with seizure frequency. (a-e) Differences in CYP isoform expression between EPI and NON-EPI tissues (Δ) were associated with individual subject seizure frequency and duration of epilepsy. A direct correlation between the percent change in CYP3A4 expression (c) in EPI and NON-EPI brain regions (n = 16 subjects) vs. respective seizure frequency was observed in the same subjects (*p < 0.003, r = 0.71). However, non-significant correlations were obtained for (a) CYP1A1 (p = 0.64; r = −0.13); (b) CYP2C9 (p = 0.72; r = 0.09); and (d) CYP2E1 (p = 0.74; r = −0.09). Within the subjects analyzed no association was noticed between CYP isoforms and duration of epilepsy (a) CYP1A1 (p =0.68; r = −0.11); (b) CYP2C9 (p = 0.73; r = 0.09); (c) CYP3A4 (p = 0.85; r = 0.05); (d) CYP2E1 (p = 0.84; r = 0.05); (e) CYP2D6 (p = 0.74; r = −0.08). The bubble graph with dot plot (in the right, a-e) shows the distribution pattern of CYP isoforms together with seizure frequency and duration of epilepsy. The plot suggests that with the same duration of epilepsy, the increase in seizure frequency was exclusively associated with the increased change in CYP3A4 levels between EPI and NON-EPI regions (c; indicated by the different size circle). This trend was absent in case of CYP1A1 (a) and CYP2C9 (b) and somewhat reversed for CYP2E1 (d) and CYP2D6 (e). The linear correlation (Pearson’s co-efficient, r) for each comparison was determined by one-way ANOVA. Asterisks indicate p < 0.05.

