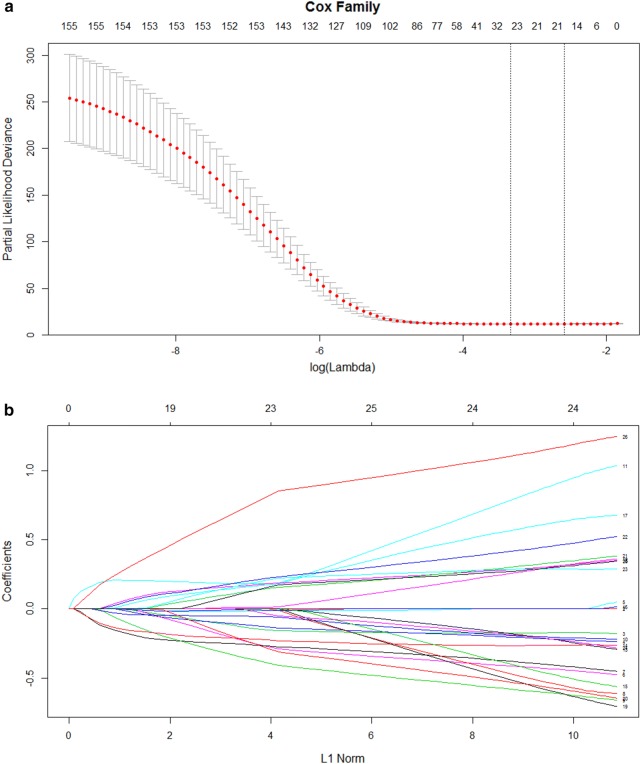
Fig. 1.
The selection of prognostic mRNAs determined by the least absolute shrinkage and selection operator Cox regression model. a Tuning parameter selection cross-validation error curve. The vertical lines were drawn according to the values of the minimum criteria and the 1-SE criteria. b The path of the coefficients of the 26 differentially expressed mRNAs included in the optimal model

