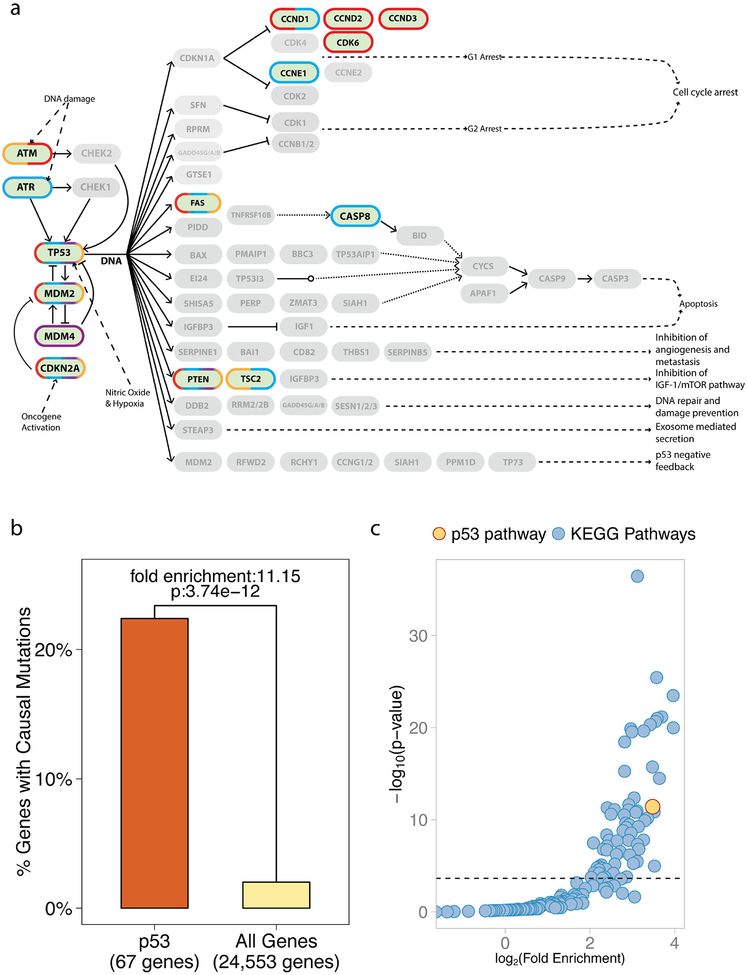
Figure 1. Somatic, causal mutations occur in a high proportion of p53 pathway genes.
(A) A pathway diagram of the p53 pathway as annotated by KEGG. Genes for which mutations have been causally implicated in cancer appear darker and are outlined (Cancer Gene Census, Sanger). A blue outline indicates causally mutated genes in epithelial cancers, red in leukemia/lymphomas, purple in mesenchymal cancers and orange in other types of cancers. (B) A bar graph of the percent of genes in the p53 pathway with known causal mutations compared to all annotated autosomal genes of the genome. 15 out of 67 genes in the p53 pathway (22.38%) are known to be causally mutated, which represents a significant 11.15-fold enrichment over the rest of the genes in the genome (p-value: 3.74e-12 is also depicted). (C) A scatter plot showing the fold enrichment of causally mutated genes on the x-axis (log-scale), and the p-value on the y-axis (-log10 scale). The horizontal line represents the 5% Family Wise Error Rate threshold (Bonferroni adjusted-p-value: 0.05). The enrichment of causal mutations in p53 pathway genes (in yellow) is the highest and the most significant compared to the other 214 annotated KEGG pathways (in blue). Overall, 30% pathways demonstrated significant enrichment of causally mutated genes.

