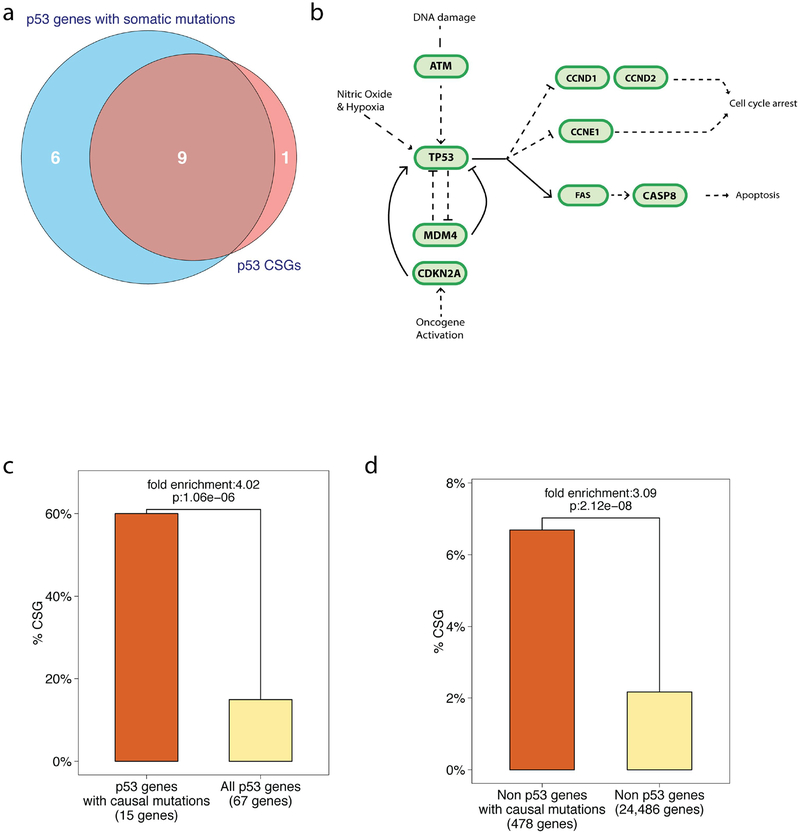
Figure 8. p53 pathway CSGs are frequently causally mutated in cancer.
(A) A Venn diagram depicting the overlap of p53 pathway genes that harbor causal mutations and pathway genes that are CSGs. (B) A pathway diagram of the CSGs annotated to the p53 pathway. (C). A bar graph depicting the percentage of CSGs found among those p53 pathway genes with known causal mutations in cancers and those pathway genes without known mutations. (D) A bar-plot depicting the enrichment of CSGs in genes known harbor causal somatic mutations relative to non-causally mutated genes in non-p53 pathway genes.

