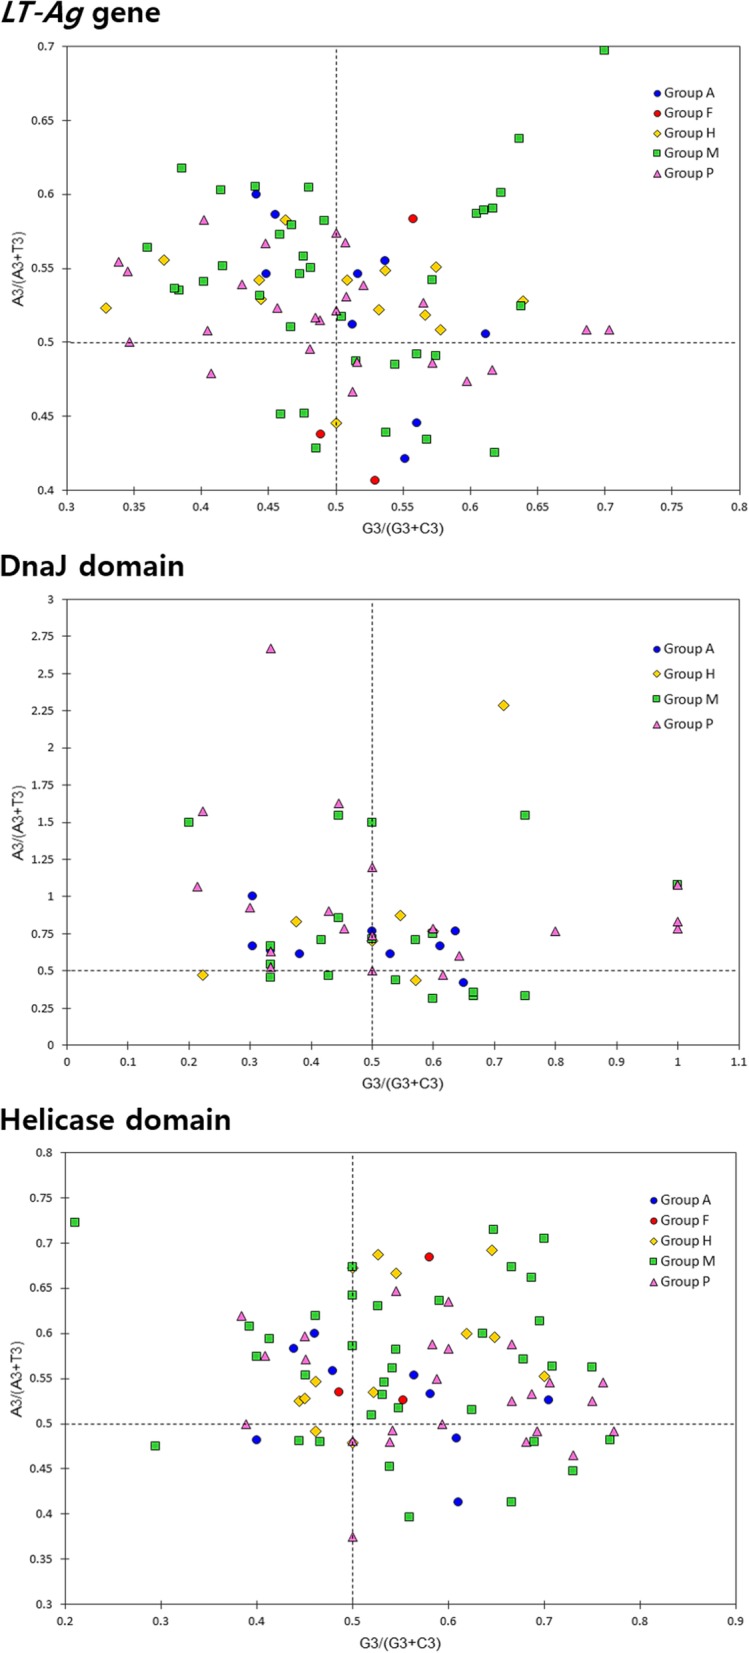
Fig. 5.

PR2-bias plot analysis. A3/(A3 + T3) were plotted against G3/(G3 + C3). The A3 content is greater than T3, and the G3 content is greater than C3 in CDS of LT-Ag genes, DnaJ domains, and helicase domains from different host species. These LT-Ag genes and their retained domains prefer to use the T-end and G-end codons
