Fig. 1.

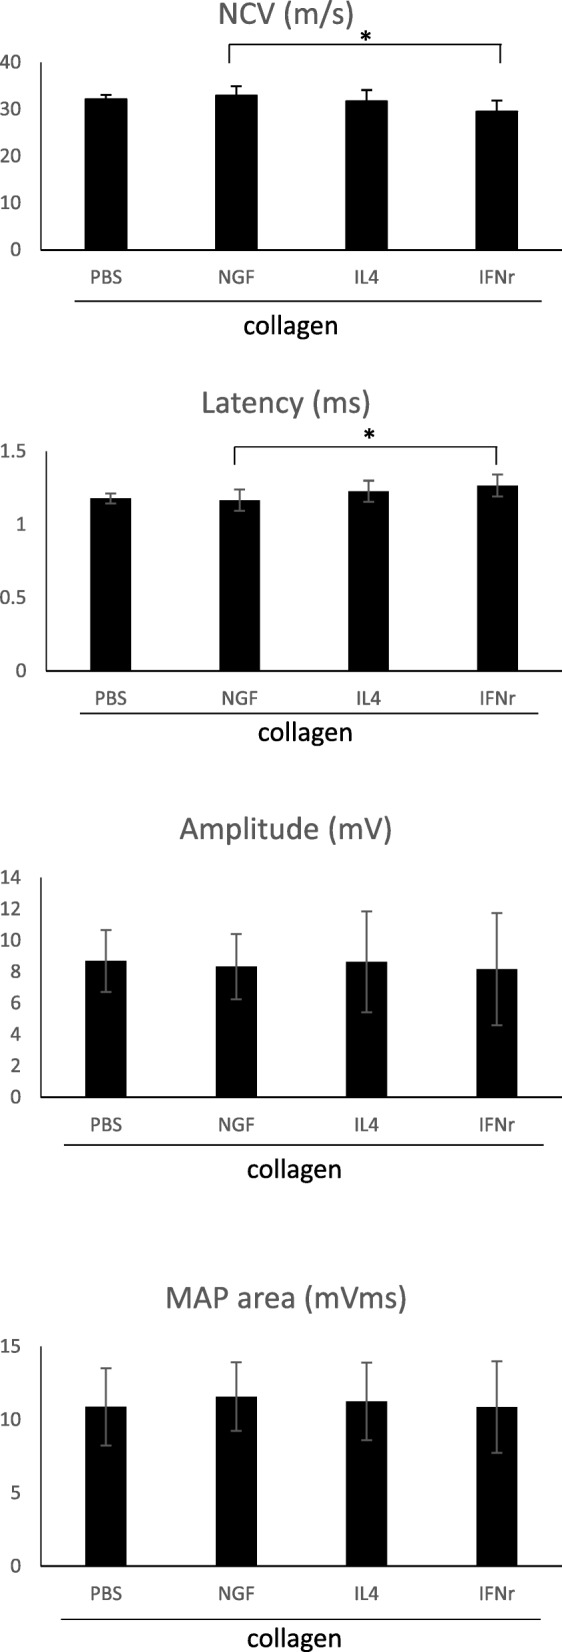
Analysis of evoked MAPs, including NCV, latency, peak amplitude, and area under the MAP curves. *Significant differences between conditions, P < 0.05

Analysis of evoked MAPs, including NCV, latency, peak amplitude, and area under the MAP curves. *Significant differences between conditions, P < 0.05