Fig. 3.

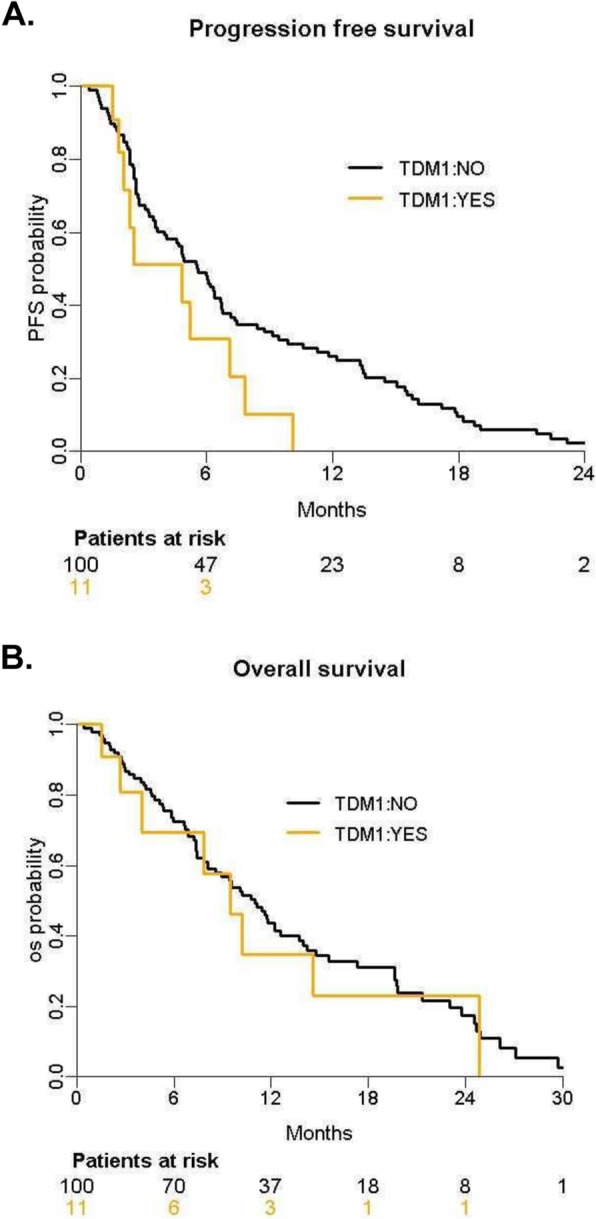
Survival curves. Progression-free survival (a) and overall survival (b) for patients with ≥ 1 HER2amp CTC treated with T-DM1 (in yellow) and patients with ≥ 1 CTC but no HER2amp CTC, treated per standard of care (in black)

Survival curves. Progression-free survival (a) and overall survival (b) for patients with ≥ 1 HER2amp CTC treated with T-DM1 (in yellow) and patients with ≥ 1 CTC but no HER2amp CTC, treated per standard of care (in black)