Fig. 3.

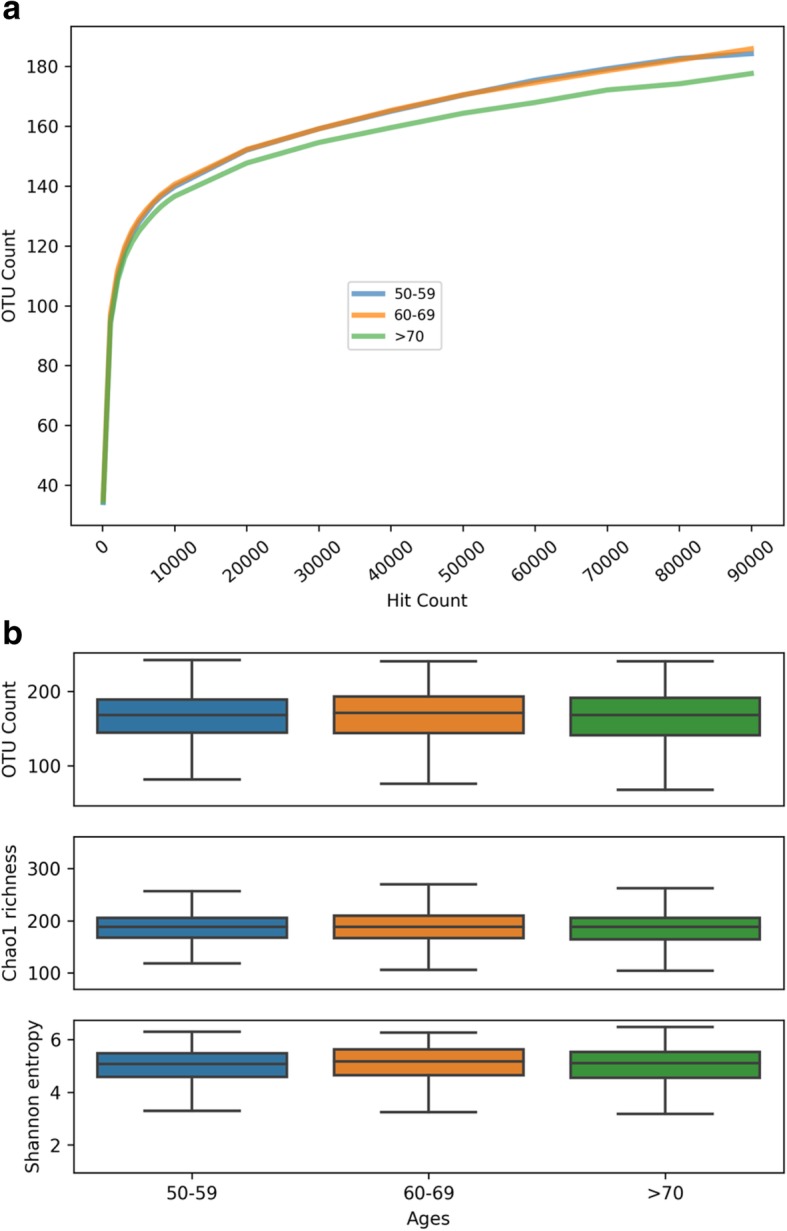
Alpha (within-group) diversity of identified taxa according to age groups. Panel a gives the rarefaction curve and Panel b gives measures of richness (Chao-1, P = 0.55; OTU counts, P = 0.35) and evenness (Shannon entropy, P = 0.42)

Alpha (within-group) diversity of identified taxa according to age groups. Panel a gives the rarefaction curve and Panel b gives measures of richness (Chao-1, P = 0.55; OTU counts, P = 0.35) and evenness (Shannon entropy, P = 0.42)