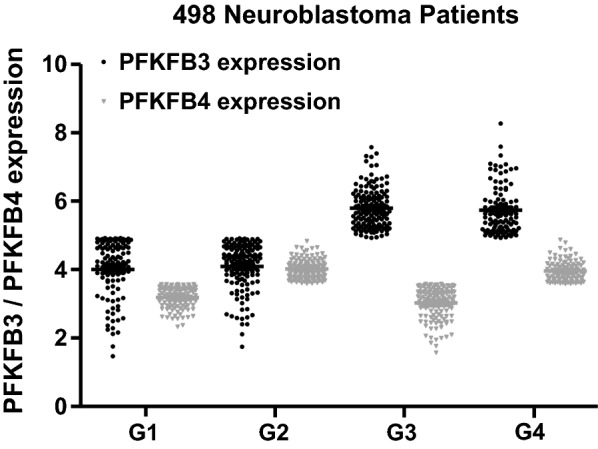
Fig. 1.

Analysis of PFKFB3 and PFKFB4 mRNA expression in neuroblastoma patients using a publicly available data set GSE62564. 498 neuroblastoma patients were classified in accordance to their PFKFB3 and PFKFB4 mRNA expression. The patients were divided into four expression groups (G1—low PFKFB3/low PFKFB4, G2—low-PFKFB3/highPFKFB4, G3—high PFKFB3/low PFKFB4, G4—high PFKFB3/high PFKFB4) based on the median
