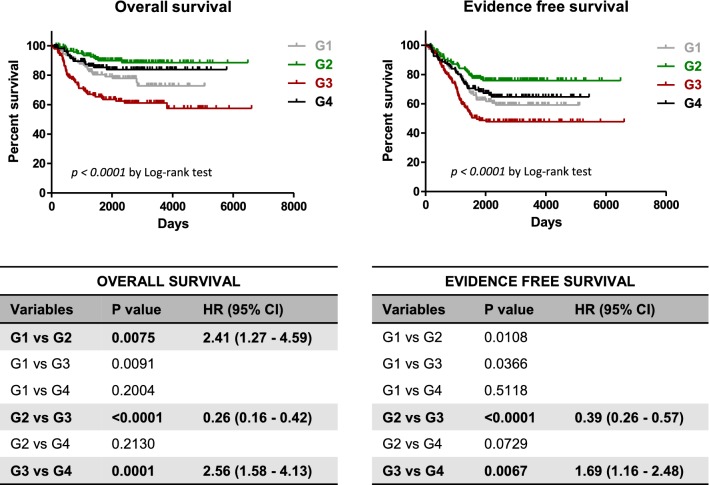
Fig. 2.
PFKFB3/PFKFB4 expression profile influences the prognosis of neuroblastoma patients. Upper panel: The publicly available data set GSE62564 was used to analyze the overall survival and evidence free survival in four expression groups G1, G2, G3, G4. Kaplan–Meier curves are presents for overall survival and evidence free survival. Lower panel: Survival curves comparison using the log-rank test with Bonferroni correction (p value below 0.0083 was considered significant). Univariate hazard ratios with confidence intervals were obtained by Cox regression analysis

