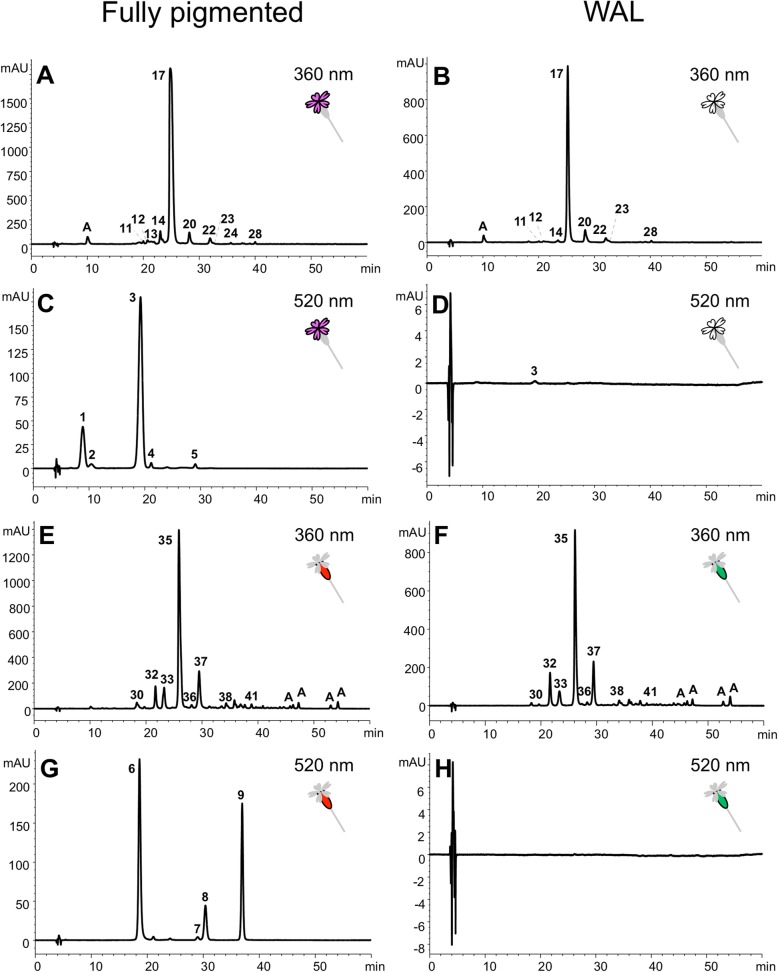
Fig. 2.
Examples of chromatograms of petals (a-d) and calyces (e-h) extracts from fully pigmented and WAL plants from Barra population recorded at 360 nm (flavones) and at 520 nm (anthocyanins). Only main peaks are numbered (details are shown in Additional file 5: Figure S2, Additional file 6: Figure S3 and Additional file 4: Table S3; A = phenolic acids)

