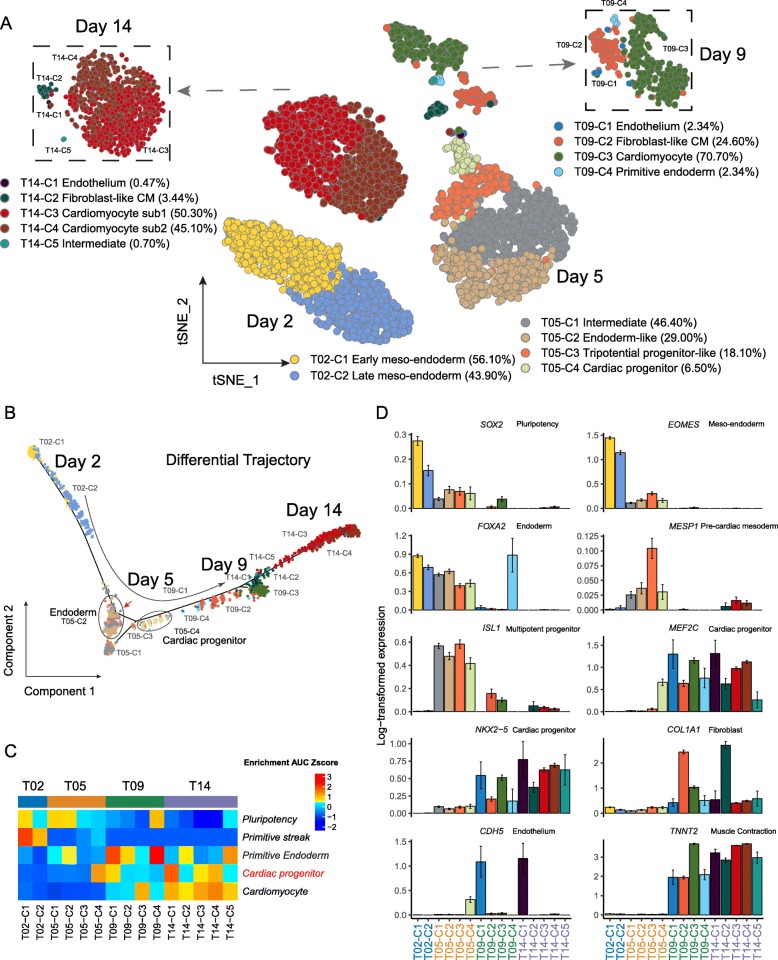
Fig. 2.
Reconstruction of the developmental trajectory of cardiac differentiation from human embryonic stem cells. a A two-dimensional t-SNE plot at a higher resolution displaying the cellular heterogeneity across four time points around cardiac lineage commitment. The subpopulations at day 9 (upper left) and day 14 (upper right) are highlighted separately. b Reconstruction of cell differentiation trajectory from day 2 to day 14. Endoderm cells and cardiac progenitors are highlighted on the pseudotime trajectory. The red arrow indicates the bifurcation point. c Scaled enrichment area under the curve (AUC) score of known marker genes representing developmental stages/typical cell types across four time points. d Barplots to show gene expression of the canonical markers representing various developmental stages/typical cell types across four time points. The height of the bar stands for the mean expression level. The error bar stands for one standard error of mean (SEM)

