Fig. 5.
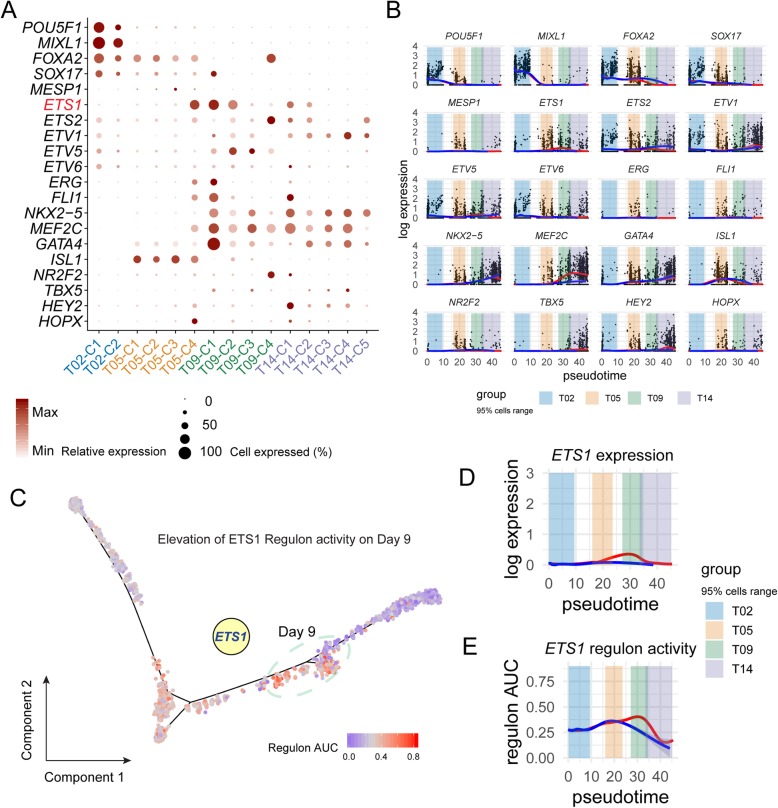
ETS1 highly correlates with cardiac differentiation. a The expression pattern of ETS family and other well-characterized cardiac transcription factors in subpopulations from four time points. The size of the dots reflects the percentage of cells expressing specific markers, and the shade of the dots represents their relative expression level. b Expression dynamics of well-characterized transcription factors and ETS family along inferred pseudotime. The pseudo-temporal positioning of every cell was based on the estimation when constructing the cell differentiation trajectory in Fig. 2b. The red branch indicates cardiac lineage, and the blue branch indicates endoderm lineage. The branch lines were smoothed using “Loess” function on cells’ expression. The colored regions mark the inferred pseudotime range of 95% of cells from a specific time point. c Putative regulon activity (AUC) of EST1 mapped on the differentiation path. The elevation of regulon activity was observed from day 5 to day 9. Day 9 cells are highlighted. Dynamics of expression (d) and putative regulon activity (e) of ETS1 aligned on differentiation pseudotime

