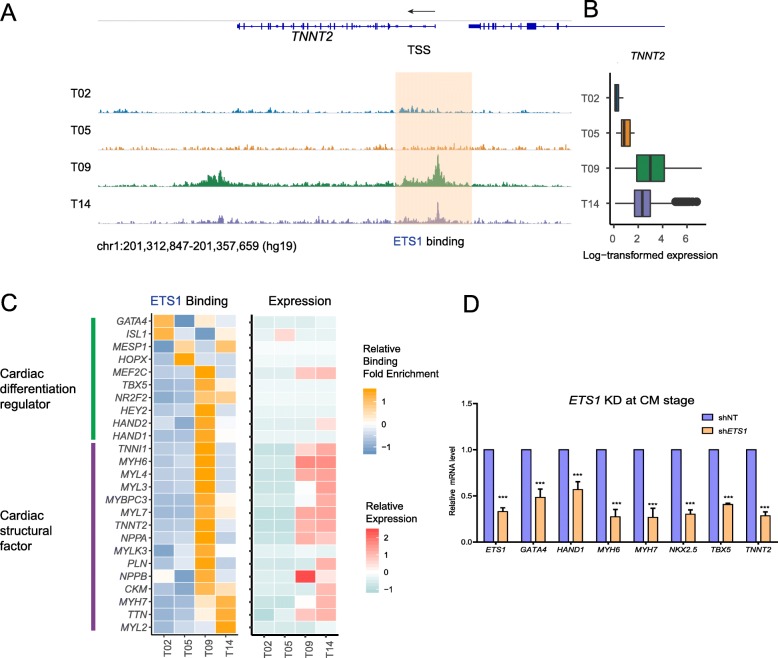
Fig. 6.
ETS1 directly regulates cardiac genes to promote cardiac differentiation. a Genome tracks to show ETS1 occupancy at the transcription start site of TNNT2 at different time points. b Boxplot to display the expression level of TNNT2 at corresponding time points. c Left: the normalized ChIP-Seq binding signals of ETS1 at the transcription start site of known cardiac TFs and cardiac structural genes. Right: the expression level of the same genes. d Real-time PCR to show the expression of cardiac genes in the presence of shNT or shETS1. Values were normalized to β-actin and plotted as mean ± SEM from three independent experiments. p value was calculated by Student’s t test. ***p < 0.001

