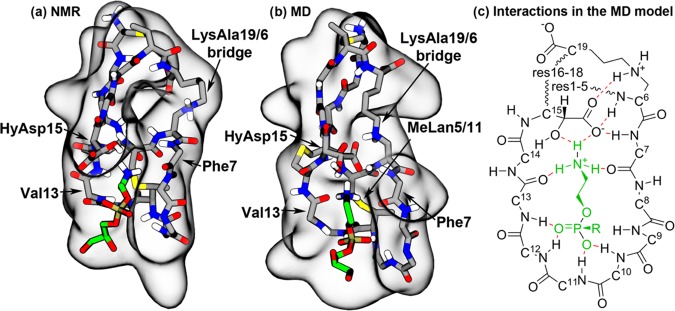
Figure 4.
NMR structure and the MD-optimized cinnamycin–PE complex. (a) The NMR and (b) the MD models of the PE–cinnamycin complex with the surface of the peptide shown in gray and the bound lipid colored green. For clarity, the peptide is visualized as its main chain and its modified side chains (excluding nonpolar hydrogens), while the lipid is shown without its hydrophobic tails (a figure with the tails shown is found in Figure S4d in the SI). (c) Schematic drawing of the optimized binding mode. The peptide is illustrated in black, the lipid head group in green, and the hydrogen bonds in red. Wavy lines indicate that backbone atoms have been omitted for clarity. All side chain atoms excluding HyAsp15 and LysAla19/6 have been omitted for clarity. Numbers on the Cα-carbons specify the residue numbers.

