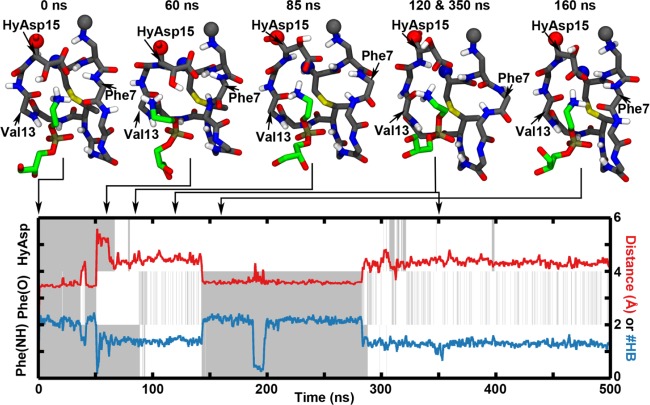
Figure 6.
Temporal evolution of a simulation of cinnamycin bound to one POPE molecule embedded in a POPC bilayer (simulations named PE_HyAsp). The plot shows the change in the orientation of the HyAsp15 side chain, Phe7(O), and Phe7(NH) over time (gray when the given group points into the binding pocket and otherwise white), the distance between the ammonium group of the lipid and the binding pocket (red line), and the number of hydrogen bonds between the ammonium group of the lipid and cinnamycin (blue line). The left y axis describes the gray and white coloring, while the right y axis describes the red and blue curves. Above the plot, snapshots of the complex are shown. It is interesting to notice how the HyAsp15 rotated in the 85 ns snapshot was followed by the Phe(NH) rotating out of the binding pocket, as shown in the snapshot at 120 ns. The lipid ammonium group has moved out of the ammonium-binding pocket at 60 ns and has rebound again in the snapshot at 160 ns.

