Abstract
The relay (on–off) controller can stabilize wide ranges of processes including open-loop stable, integrating, and unstable processes, producing sustained oscillations. For improved proportional-integral-derivative controller tunings, methods to find process models with mixed closed-loop tests of relay feedback and proportional-derivative (PD) controllers are proposed. For unknown processes with arbitrary initial states, relay feedback tests are first applied and, after cyclic steady states are obtained, PD controllers or other relay feedback tests with set point changes are followed. This full closed-loop operation is desirable for integrating and unstable processes and will be useful even for stable processes when processes are far from their desirable operating points. Refined methods to find exact frequency responses of processes from initial and final cyclic steady states are derived. Whole relay feedback responses need not be saved. Several integrals at the relay switching times are used without iterative tests or computations.
Introduction
Åström and Hägglund1 have used the relay feedback system to find the ultimate gain and period of a process to tune proportional-integral-derivative (PID) controllers. The method can remove cumbersome and time-consuming field tests of proportional controllers to obtain the ultimate gain for the Ziegler–Nichols tuning.2 Because of its simplicity, relay feedback has gained popularity for tuning PID controllers in the field.3−10 For improved tuning of PID controllers, parametric models such as the first order plus time delay (FOPTD) model are often identified with the additional process steady-state gain information in addition to the ultimate data of the process.11−15 For the process steady-state gain, the relay feedback test should often be performed from the initial steady-state condition. For integrating and unstable processes, it will be hard to maintain the steady state without closed-loop control. Some previous methods assume that processes are initially at steady states. Otherwise, closed-loop identifications are tried while assuming that stabilizing controllers are available. When stabilizing controllers are not known in advance, several trial tests to find them will be inevitable. Here, for the purpose of stabilizing the process and maintaining initial test conditions, the relay feedback system is used and methods to analyze tests from initial cyclic steady states are proposed. Trial tests to find stabilizing controllers can be skipped, resulting in reduced test times.
Relay controllers can stabilize a wide range of unstable processes with time delays. Co16 investigated relay stabilizations of unstable processes with time delays. Mehta17 studied methods to enlarge the range of unstable processes by introducing a proportional-derivative (PD) controller to the relay feedback system and proposed identification methods to obtain parametric models. Methods to obtain parametric models for unstable processes with time delays by analyzing the relay feedback oscillations at the cyclic steady state have been proposed by several researchers.18−20 These methods assume that a process is at a steady state initially when the relay feedback starts. Marchetti et al.21 used two relay feedback tests with changing time delay elements in the feedback loop to obtain low order plus time delay models and design PID controllers.
The relay feedback method can also be used to identify integrating processes with time delays. First-order and second-order integrating plus time delay models are identified from measurements of several representative points in the relay feedback oscillations at the cyclic steady state.10,22,23 For this, exact expressions of relay oscillations are used. Because the equations are nonlinear for model parameters of the second-order integrating processes with time delays, iterative computations are often required.
Here, relay feedback is used to stabilize the processes and to maintain the operating points for identification. Identification tests start from the cyclic steady states. To analyze responses that are cyclic steady states initially, methods to find exact frequency responses24,25 are refined. By introducing additions and subtractions between shifted responses, responses whose initial and final steady states are both zero are obtained, so that integrations to compute process frequency responses are possible. By applying Fourier transforms, exact frequency responses and corresponding low order plus time delay models are obtained. From initial relay feedback oscillations, useful process information for the second closed-loop test is obtained. Hence, as for the conventional relay feedback autotuning methods, the process information needed a priori can be minimized regardless of the process type (stable, integrating, or unstable). Simulation and experimental results are given to illustrate performance of the proposed methods.
Process Activations
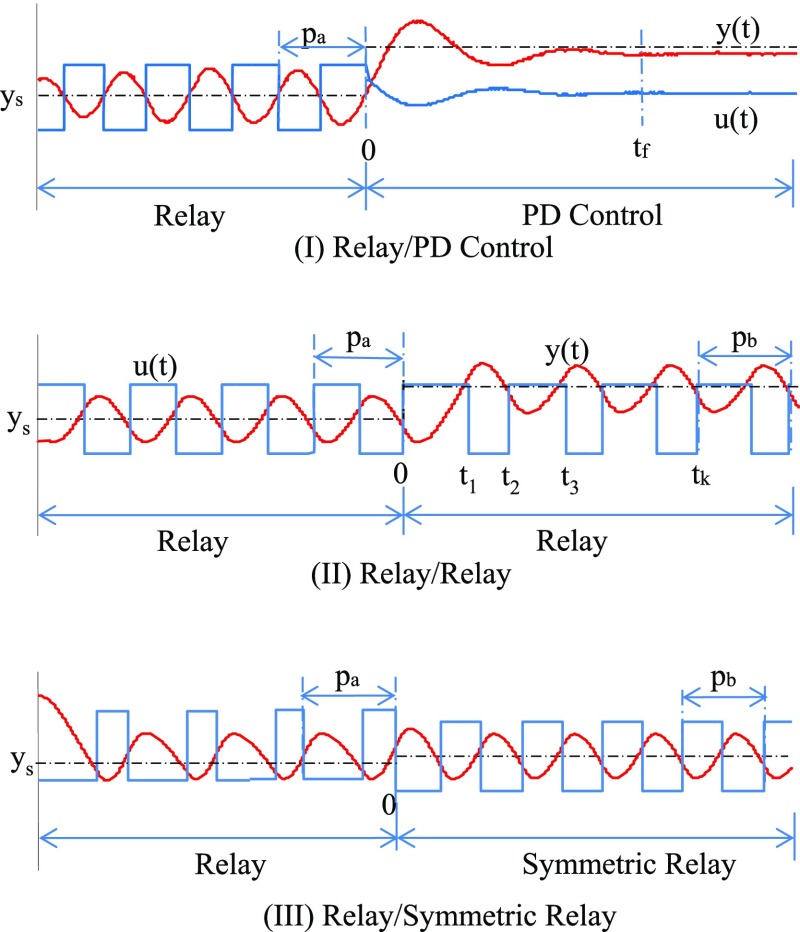
Several types of closed-loop tests as shown in Figure 1 are considered.
Figure 1.
Three types of closed-loop tests.
Activation Type I (Relay/PD Control)
The first type of closed-loop test (Figure 1(I)) is such that a relay feedback test is followed by a closed-loop test with a PD controller. The relay feedback system will bring the process close to a given operating point. When the relay oscillation reaches the cyclic steady state, a PD controller is designed with Ziegler–Nichols type tuning based on the ultimate data and then the closed-loop test is implemented with this PD controller.
Activation Type II (Relay/Relay)
The second type of closed-loop test (Figure 1(II)) has a relay feedback test followed by another relay feedback test. For the second relay feedback test, the set-point change should be applied to obtain the process steady-state gain accurately.
Activation Type III (Relay/Symmetric Relay)
In this method, the second relay feedback responses are assumed to be symmetric (Figure 1(III)). Relay feedback methods that guarantee symmetric oscillations by removing the static load disturbances26,27 can be used. For integrating processes, the second symmetric relay oscillations can be realized just by removing the steady-state values of inputs obtained from the cyclic steady states of the first relay feedback. These symmetric oscillations are not affected by set-point changes of the second relay tests.
Frequency Response Estimations
Methods to obtain process frequency responses are first derived. Consider the linear time invariant process
| 1 |
where G(s) is the process transfer function, Y(s) and U(s) are the Laplace transforms of the process output y(t) and input u(t).
From the input and output responses of Figure 1, frequency responses will be obtained. For this, we consider the shift transformations
| 2 |
where pa and pb are periods of the first and second parts of responses at the cyclic steady states (Figure 1), respectively. The transformed responses of eq 2 are shown in Figure 2 and their Laplace transformations can exist. As the transfer function between each delayed input and output is G(s), we have
 |
3 |
Figure 2.
Transformed responses.
Hence, frequency responses of G(s) can be obtained by analyzing responses of u̅(t) and y̅(t), whose Laplace transforms are U̅(s) and Y̅(s), respectively.
Proposition 1 (Activation Type I–III)
Consider responses of Figure 1. It is assumed that responses are periodic for t < 0 and t > tf, whose periods are pa and pb, respectively. Then,
 |
4 |
Proof: Applying the Laplace transformations to responses of eq 2, we have
| 5 |
Putting eq 2 leads to eq 4. Detailed calculations are given in the Appendix.
Kim et al.25 proposed a similar equation for process frequency responses. The first relay oscillations are assumed to be continued for t > 0 and deviation responses from the extended responses of the first relay are analyzed. In eq 4, such imaginary responses are not needed.
The term exp(−αt) in the above equations can reduce magnitudes of responses of u(t) and y(t), making responses integrable for the computations of frequency responses.9 However, there is a lower limit in the choice of α to guarantee the desired decrement rate. In the proposed method, because the transformed responses of eq 2 are integrable without the term exp(−αt), even α = 0 can be used. Here, the term exp(−αt) with a small α is used to reduce noise effects.
Corollary 1-1 (Activation Type I)
When the final states are constant (the period pb is zero), then
 |
6 |
Proof: Applying the L’Hospital law
| 7 |
Corollary 1-2 (Activation Type II–III)
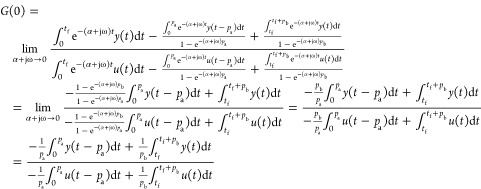
The process steady-state gain becomes
 |
8 |
Proof: Applying the L’Hospital law
 |
9 |
Corollary 1-3 (Activation Type I)
When the final states are constant, the process steady-state gain becomes
 |
10 |
Proof: Applying the L’Hospital law to eq 8 for pb → 0, eq 10 can be obtained.
Consider responses of Figure 1(III) and the shift transformations
| 11 |
Here, the second relay responses are symmetric. As in eq 3, it is easy to show that Ŷ(s) = G(s)Û(s) and frequency responses of G(s) can be obtained by analyzing responses of û(t) and ŷ(t) whose Laplace transforms are Û(s) and Ŷ(s), respectively. Additions of half period responses of eq 11 can be found in Hofreiter.28
Proposition 2 (Activation Type III)
It is assumed that responses for t < 0 are periodic with a period of pa, and responses for t > tf are periodic with a period pb and are symmetric. Without the loss of generality, the average values of u(t) and y(t) at the final cyclic steady state are assumed to be zero, that is, u(t + pb/2) = −u(t) and y(t + pb/2) = −y(t) for t > tf. Then,
 |
12 |
Proof: As in proposition 1, eq 12 can be obtained by applying Laplace transforms to responses of eq 11. Detailed derivations are given in the Appendix.
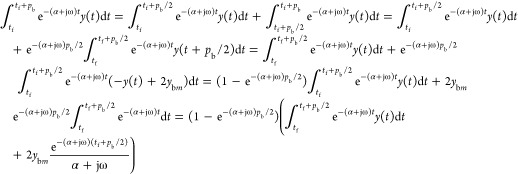
Comparing eqs 4 and 12, the last integral terms in the numerator and denominator are different. Because eq 4 can be applied to the activation type III for eq 12, the last terms of eq 4 can become the last terms of eq 12, providing another proof for eq 12. Consider
 |
13 |
Here, ybm is the average value of y(t) for t > tf and hence, y(t + pb/2) = −y(t) + 2ybm, t > tf. The same equation can be derived for the input u(t). As 1 – e–(α+jω)pb = (1 – e–(α+jω)pb/2)(1 + e–(α+jω)pb/2) and the average values of u(t) and y(t) are assumed to be zero, eq 12 can be obtained.
The assumption that the average values of u(t) and y(t) are zero can be removed by adding the average values to the last terms as
 |
14 |
Corollary 2-1 (Activation Type III)
Under the assumptions of proposition 2, the process steady-state gain becomes
| 15 |
Proof: Multiply 1 – e–(α+jω)pa to both sides of the fraction of eq 12 and take the limit, α + jω → 0. Then eq 15 can be obtained.
Special Cases
When pa = pb, we can use the shift transformation as
| 16 |
In this case, proposition 1 is still effective for computing frequency responses.
When both relay oscillations are symmetric with pa = pb, we can use the shift transformation of
| 17 |
In this case, the following changes are required in proposition 2
 |
18 |
Here, yam and uam are the average values of y(t) and u(t) for t < 0.
Identification and Tuning Methods
On the basis of the above propositions, G(α) and G(α + jω) are first obtained from the relay feedback tests. Then, low order plus time delay models and corresponding PID controller parameters are computed.
Stable Processes
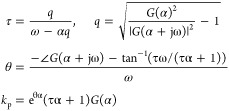
For a stable process, the FOPTD model
| 19 |
is identified. For a given G(α) and G(α + jω), each parameter becomes
 |
20 |
 |
21 |
To design PI controllers, the SIMC tuning rule30,31 is used.
Integrating Processes
For an integrating process, the second-order model
| 22 |
is identified. For a small α, G(α) will be large and its estimation can have large errors. In particular, it is impossible for α = 0. To avoid this, we consider
| 23 |
If the input u(t) is replaced by its integral
| 24 |
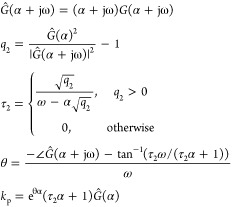
its Laplace transform becomes U(s)/s and the above method to find the FOPTD model can be applied for eq 23. Differently, from Ĝ(α) and G(α + jω), model parameters of eq 22 can be obtained as
 |
25 |
When q2 < 0, τ2 can be complex. In this case, by discarding the pole dynamics, a pure integral plus time delay model of G(s) = kp e–θs/s is identified.
This identification method for an integrating process can be applied to stable and unstable processes with a dominant time constant compared to the time delay and other time constants
| 26 |
To design PID controllers, the SIMC tuning rule30 is used.
Unstable Processes
For an unstable process, the FOPTD model
| 27 |
is identified. Each parameter becomes
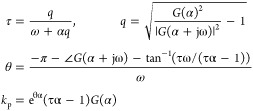 |
28 |
 |
29 |
To design PI controllers, an analytic tuning rule by Cho et al.29
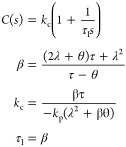 |
30 |
is used here. It requires a set point filter of FR(s) = (λs + 1)/(βs + 1) to reduce overshoot for step set-point changes.29 The design parameter, λ is set to 3θ.
Autotuning Procedures
Applying the relay feedback autotuning method, relay feedback oscillations are obtained as shown in Figure 1. Here, instead of the oscillation period and amplitude at the cyclic steady state, several integrals of relay feedback transients are used to obtain the exact frequency responses.
Proposed Method II-1
The following procedure is for the activation type II and proposition 1.
Step 1: To bring the process to a given operating point, apply a relay feedback test. Start the integration
| 31 |
Step 2: When approaching the cyclic steady state, set α and ω as
| 32 |
Obtain integrals for t between −pa and 0
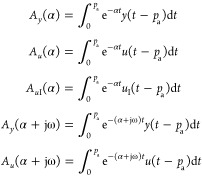 |
33 |
Step 3: At the time t = 0, the set-point is changed. Start the integrations
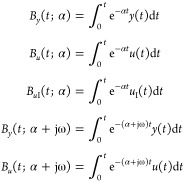 |
34 |
For the activation type II, integrals of eq 34 are saved at each relay switching time tk.
Step 4: When responses reach their cyclic steady states, terminate the test and compute
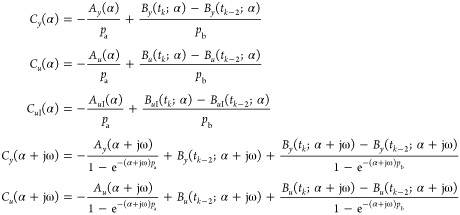 |
35 |
Step 5: Compute model parameters from
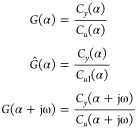 |
36 |
and determine which models are adequate among stable, integrating, and unstable process models. Then, design PID controllers.
Proposed Method I-1
For the responses of Figure 1(I) (activation type I), design the PD controller by the Ziegler–Nichols tuning rule with ultimate data obtained from the first relay feedback oscillations. In this case, proposition 1 is used and eq 35 becomes
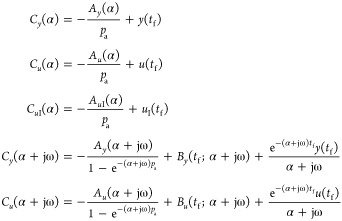 |
37 |
Proposed Method III-2
When the second relay oscillation is symmetric (activation type III), proposition 2 of eq 12 can be used. In this case, eq 35 becomes
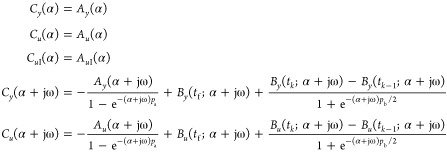 |
38 |
Results and Discussion
Process 1 (Stable Processes)
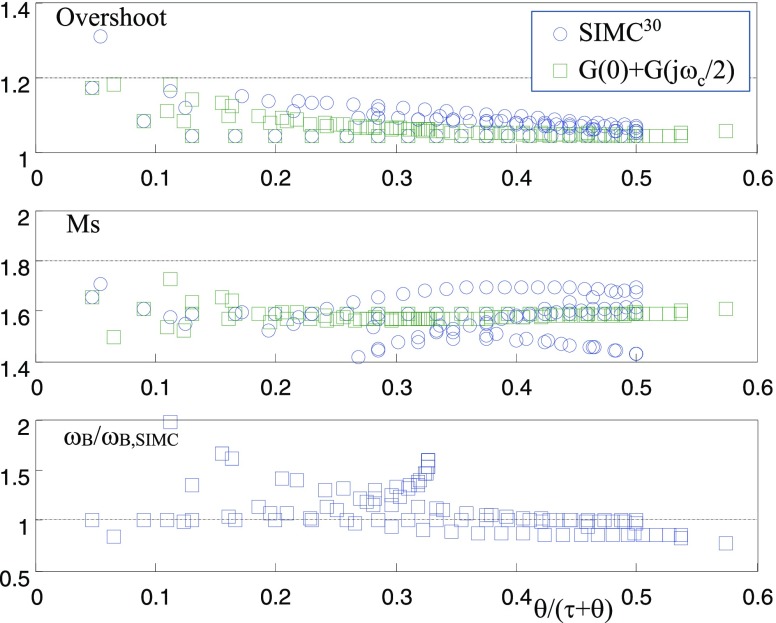
The proposed methods are based on the FOPTD model that fits G(0) and G(jωc/2), where ωc is the critical frequency, and the SIMC tuning rule.30 For a given stable process transfer function, G(0) and G(jωc/2) and the corresponding PI controller can be easily computed. Its tuning performances are first investigated. Figure 3 shows closed-loop performances for the test batch processes in Berner et al.10 It shows overshoots for step set-point changes; peak amplitude ratios of the sensitivity function ((1 + G(s)C(s))−1) and relative bandwidths are shown. They are compared with those of the SIMC model reduction and tuning method.30,31 For all processes in the test batch, overshoots are below 20% and peak amplitude ratios of the sensitivity function are below 1.8, showing that the proposed method will be less aggressive. The bandwidth plot shows that control actions of the proposed methods will be similar or faster compared to the SIMC method.
Figure 3.
Overshoots for step set-point changes, peak amplitude ratios of sensitivity functions (Ms) and normalized bandwidths of PI control systems tuned by the method of G(0) + G(jωc/2) and SIMC for stable processes (test processes in Berner et al.10).
To illustrate closed-loop performance, one of the proposed methods is applied to the process
| 39 |
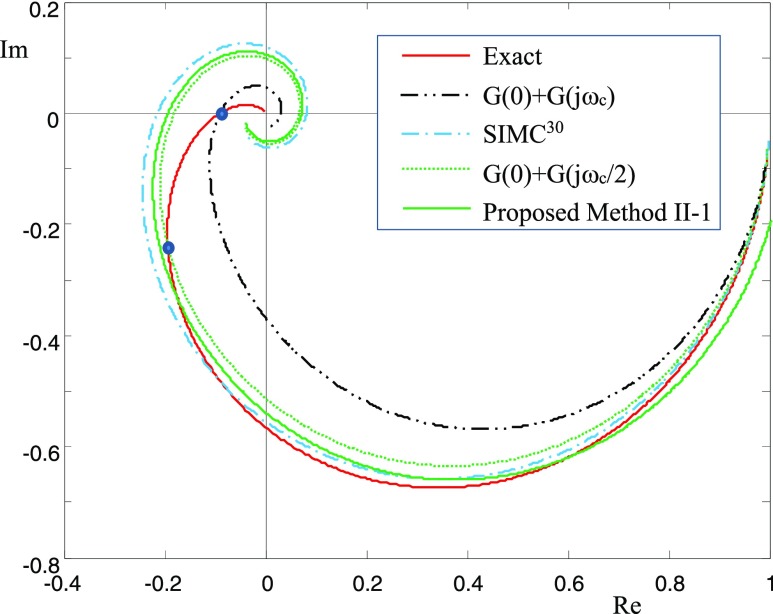
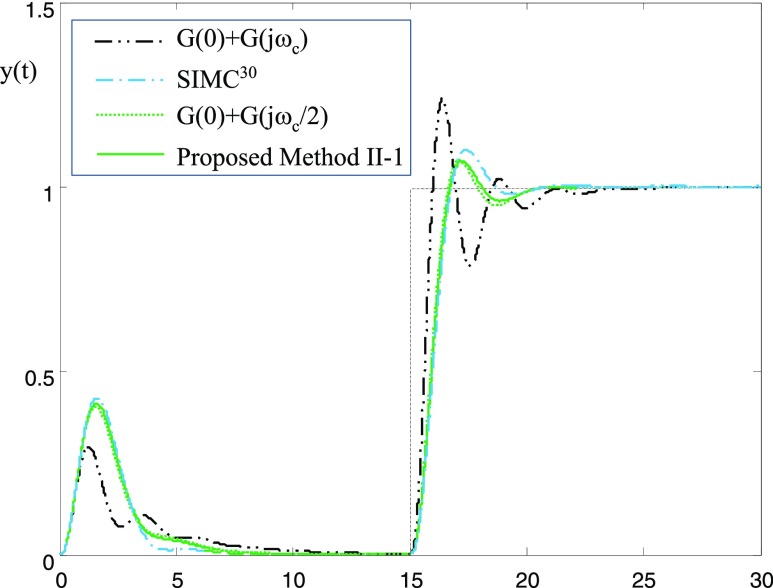
Figure 4 shows Nyquist plots of the process of eq 39 and its FOPTD models. The FOPTD model of G(0) + G(jωc) is such that it fits G(0) and G(jωc), which can be realized by conventional relay feedback methods. The FOPTD model of SIMC is obtained by applying SIMC model reduction to the process of eq 39. The FOPTD model of G(0) + G(jωc/2) is such that it fits G(0) and G(jωc/2), which is realized by the proposed methods. The model of the proposed method II-1 is the FOPTD model obtained with the activation type II. Except for the FOPTD model of G(0) + G(jωc), computed models have frequency responses close to each other, showing excellent fitting results for a low frequency range. These models will be adequate for conservative tuning of PI controllers. Figure 5 shows closed-loop responses of the above four methods. As expected with the Nyquist plots of Figure 4, all three methods except the G(0) + G(jωc) method show similar closed-loop responses, which are less aggressive. On the other hand, the G(0) + G(jωc) method, which is the background one for conventional relay feedback methods, shows somewhat oscillatory responses.
Figure 4.
Nyquist plots for the processes of G(s) = 1/(s + 1)(0.3s + 1)2 and its identified models.
Figure 5.
Closed-loop responses for the processes of G(s) = 1/(s + 1)(0.3s + 1)2.
Liquid Level Experimental System
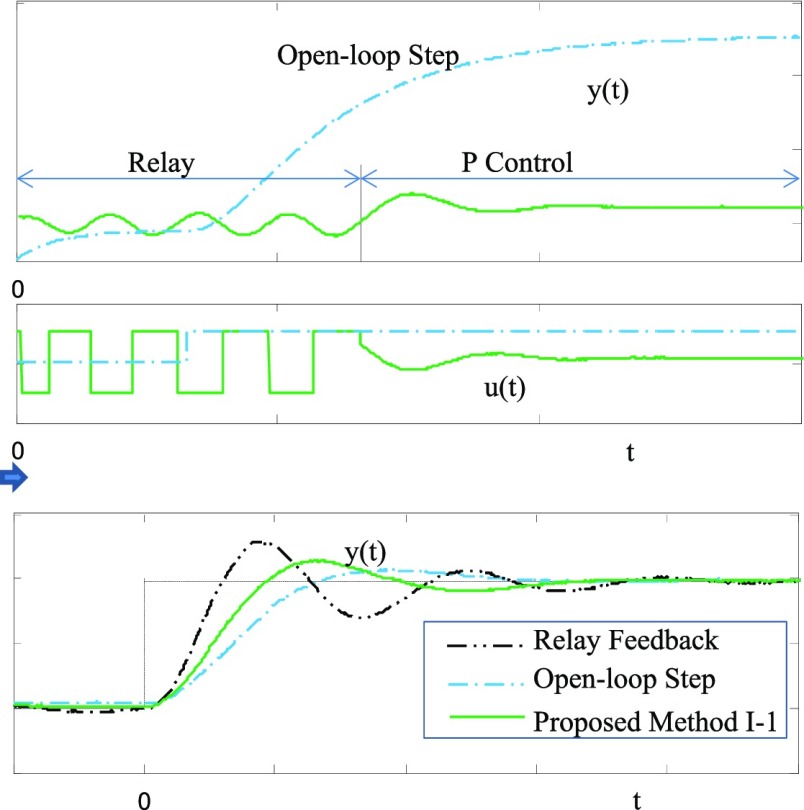
To illustrate applicability to real processes, the proposed method I-1 is tested with the liquid level experimental system, where three tanks connected in series and parallel realize third order dynamics, the level of the final tank is measured with a pressure sensor and the influent flow rate is manipulated with the pulse-width-modulated pinch valve.
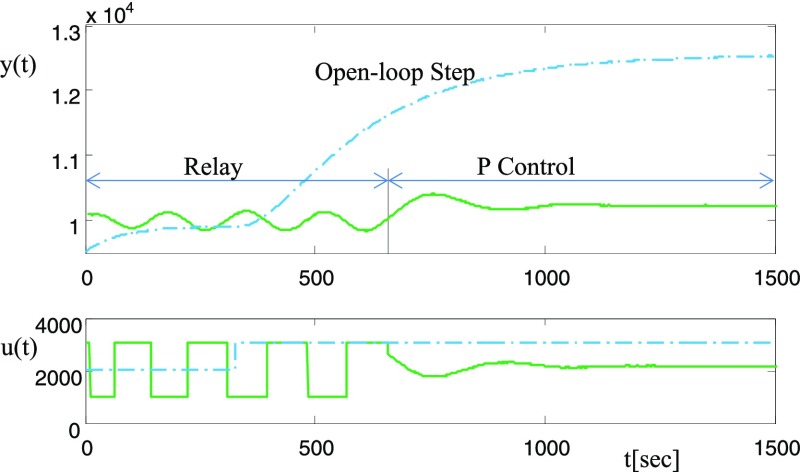
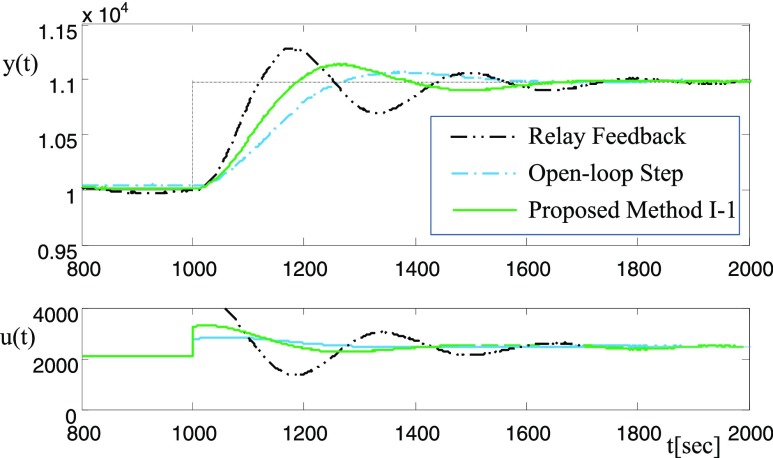
Figure 6 shows test responses. From the open-loop step test, the FOPTD model in Table 1 is obtained. From the relay feedback test, process ultimate gain and period are obtained. With the process steady-state gain information, the FOPTD model in Table 1 is obtained. With a successive P control test as shown in Figure 6 (activation type I), the proposed method I-1 can be applied. The FOPTD model obtained by the proposed method with activation type I and proposition 1 is also given in Table 1. Comparing the models obtained, the FOPTD model of the conventional relay feedback method shows that the time constant is too large. Figure 7 shows closed-loop responses. The conventional relay feedback method shows the fastest response, but it is somewhat oscillatory. The open-loop step test method shows the slowest response. Response of the proposed method I-1 placed between those of the conventional relay feedback method and the open-loop step test method.
Figure 6.
Experimental test responses.
Table 1. Identified Models.
| process | method | kp | τ | θ | GMa | PMa | Msa |
 |
SIMC30 | 1 | 1.15 | 0.45 | 5.7 | 58 | 1.5 |
| G(0) + G(jωc) | 1 | 2.6469 | 0.3943 | 2.8 | 39 | 2.2 | |
| G(0) + G(jωc/2) | 1 | 1.4715 | 0.4728 | 5.2 | 60 | 1.6 | |
| proposed II-1 | 1.0321 | 1.3775 | 0.4614 | 5.5 | 61 | 1.5 | |
 |
SIMC30 | 1 | 1.5 | 9.5 | 3.0 | 47 | 1.7 |
| Liu and Gao22 | 1.018 | 2.5293 | 8.5278 | 2.9 | 47 | 1.7 | |
| Panda et al.23 | 0.2291 | 2.0051 | 5 | 0.4 | 232 | 1.5 | |
| proposed II-1 | 1.0000 | 2.0099 | 9.0019 | 3.0 | 47 | 1.7 | |
| proposed III-2 | 0.9997 | 1.9720 | 9.0791 | 3.0 | 47 | 1.7 | |
| proposed III-2b | 0.9250 | 0 | 11.107 | 2.9 | 46 | 1.8 | |
 |
Park et al.32 | 1.002 | 2.347 | 1.067 | |||
| Majhi and Atherton33 | 1.0 | 2.875 | 1.061 | ||||
| Liu and Gao22 | 0.99 | 2.1703 | 1.0303 | ||||
| proposed II-1 | 0.9991 | 2.0937 | 1.0405 | ||||
| proposed II-1c | 1.0019 | 2.1036 | 1.0455 | ||||
| liquid level experimental system | open loop step | 2.885 | 283.5 | 87.5 | |||
| relay feedback | 2.687 | 574.1 | 77.3 | ||||
| proposed I-1 | 2.693 | 357.6 | 56.9 |
GM, PM, and Ms are the gain margin, phase margin, and the peak amplitude ratio of the sensitivity function, respectively.
Uniform noise between −0.01 and 0.01.
Uniform noise between −0.025 and 0.025.
Figure 7.
Experimental closed-loop responses.
Process 2 (Integrating Process)
Consider the process
| 40 |
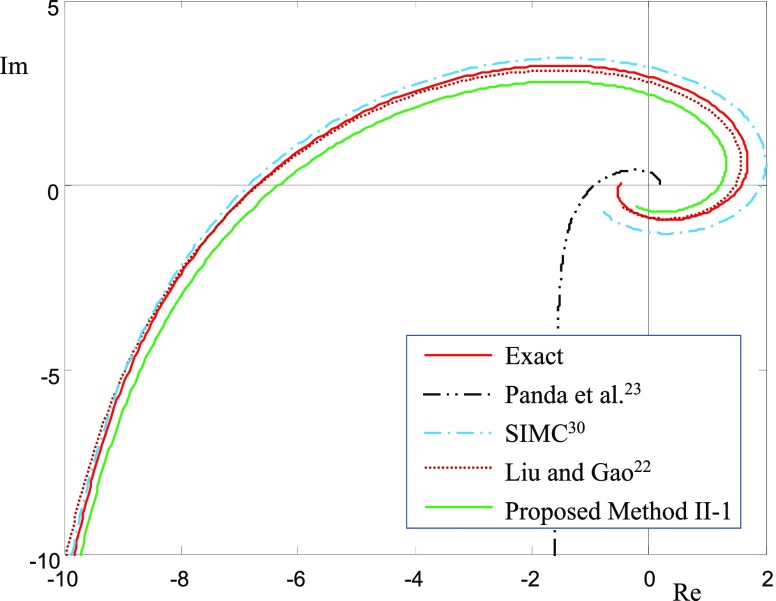
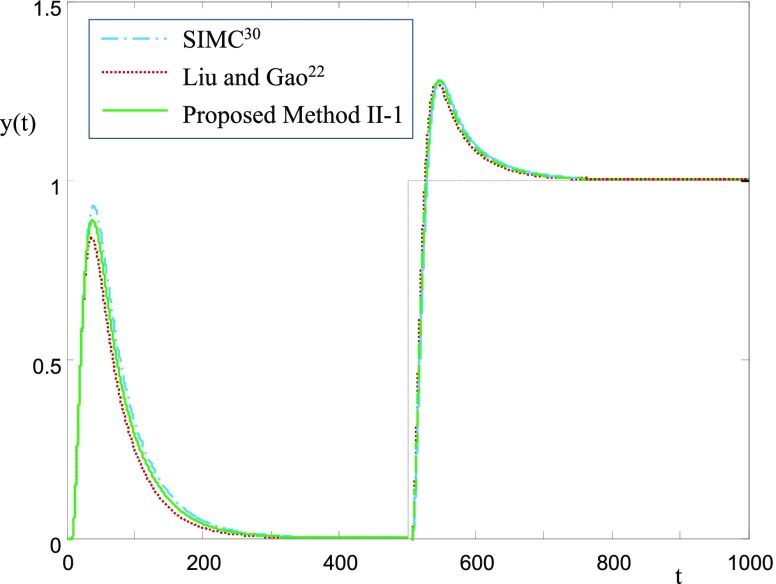
Integral and FOPTD (IFOPTD) models are compared. When the exact transfer function is given, IFOPTD model can be obtained by applying the SIMC model reduction method.30,31 Liu and Gao22 and Panda et al.23 have reported IFOPTD models from a relay feedback test. Table 1 shows IFOPTD model parameters. The proposed method II-1 (activation type II and proposition 1) and III-2 (activation type III and proposition 2) provide very similar IFOPTD models, whose closed-loop responses are not distinguishable. When noise is added, the time constant, τ2 can be complex sometimes. In this case, the time constant is set to zero and the pure integral plus time delay model is identified. Except the IFOPTD model of Panda et al.,23 frequency responses are all similar (Figure 8). The model of Panda et al.23 should be replaced by their integral model having a zero term. Figure 9 shows closed-loop responses. They are all excellent.
Figure 8.
Nyquist plots for the
integrating process of  and second-order integral models identified.
Figure 9.
Closed-loop responses for the integrating process of  .
.
Process 3 (Unstable Process)
Consider the process
| 41 |
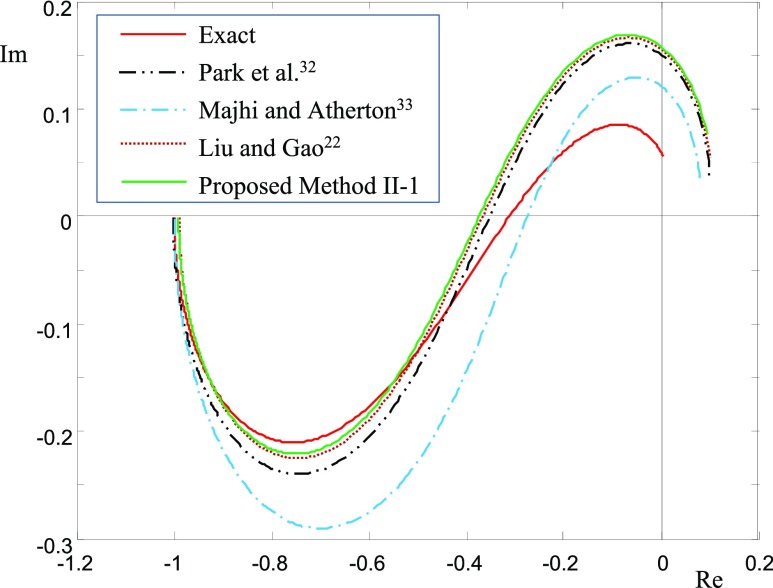
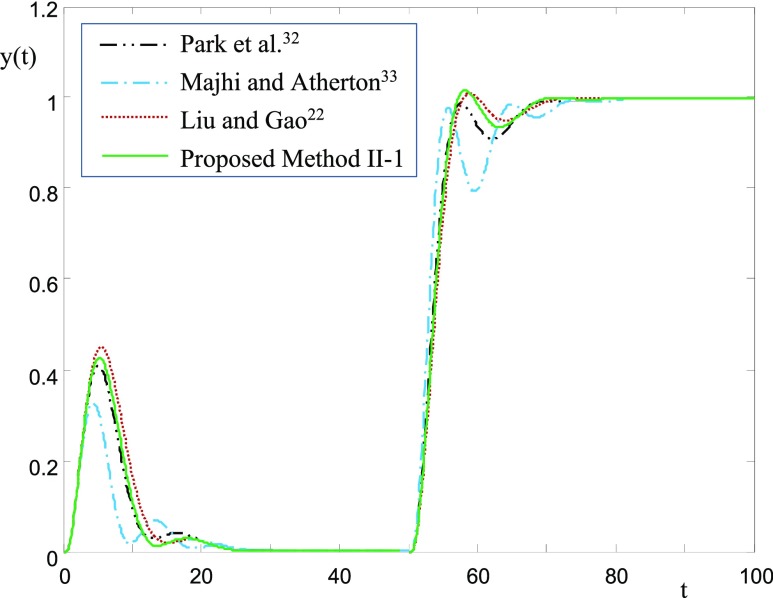
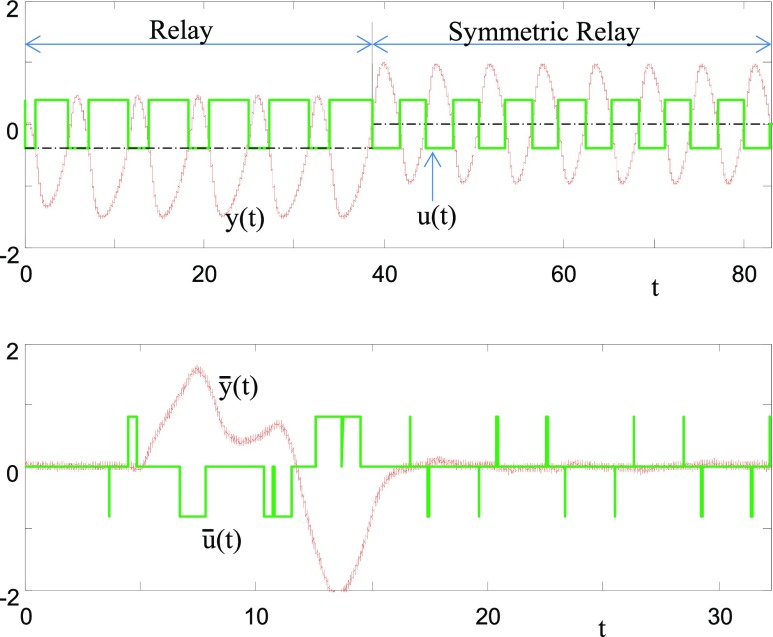
Unstable FOPTD models reported by Park et al.,32 Majhi and Atherton,33 and Liu and Gao22 are compared. Table 1 shows the FOPTD model parameters. The proposed method II-1 (activation type II and proposition 1) is applied to this unstable process. Figure 10 shows Nyquist plots. Except the FOPTD model of Majhi and Atherton,33 frequency response fittings are all excellent. Figure 11 shows closed-loop responses. All methods are acceptable. Figure 12 shows test responses of the proposed activation type II under noisy environments. As given in Table 1, noise with small magnitude does not affect the model parameter estimations much.
Figure 10.
Nyquist plot for the
unstable process of  and its models identified.
Figure 11.
Closed-loop
responses for the unstable process of  .
.
Figure 12.
Proposed relay feedback tests under noisy environments
for the
unstable process of  .
.
Conclusions
Relay feedback autotuning methods for stable, integrating, and unstable processes with time delays are proposed. For the relay feedback tests, two successive tests of relay/PD control and relay/relay are used. The first relay feedback test is to derive the process at a given operating point and to maintain the cyclic steady states for starting the identification test. Then, the second test with process information obtained from the first relay feedback oscillation is followed. Methods to obtain the exact frequency responses from the relay feedback responses that are at cyclic steady state initially are proposed. Low order plus time delay models are obtained from the steady-state gain and frequency responses at half the critical frequencies.
For stable processes with time delays, the proposed method based on the FOPTD model obtained from the steady-state gain and frequency response at half the critical frequency is shown to be acceptable, reducing the somewhat aggressive closed-loop performance of conventional relay feedback methods. When the process is far from the desirable operating condition, the first relay feedback test will be very useful in obtaining the desirable steady state to start the identification test. For integrating and unstable processes, closed-loop tests are desirable and our relay feedback tests can be promising candidates. Simulations and experiments illustrate the usefulness of the proposed methods.
Acknowledgments
This research was supported by Basic Science Research Program through the National Research Foundation of Korea(NRF) funded by the Ministry of Education (2016R1D1A1B03934408).
Appendix
A1: Proof of Proposition 1
Consider the frequency response
| A1 |
Here
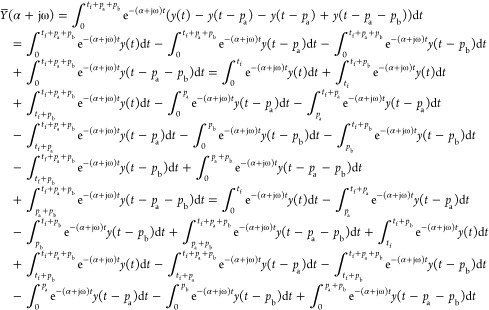 |
A2 |
Terms are rearranged and simplified. The main integrations become
 |
A3 |
As y(t) = y(t – pb) for t > tf + pb, integrations after t = tf become
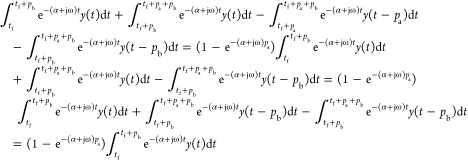 |
A4 |
As y(t – pb) = y(t – pa – pb) for t < 0, integrations before t = 0 become
 |
A5 |
The same equations are obtained for U̅(α + jω). The proposition 1 follows.
A2: Proof of Proposition 2
Consider the frequency response
| A6 |
Here,
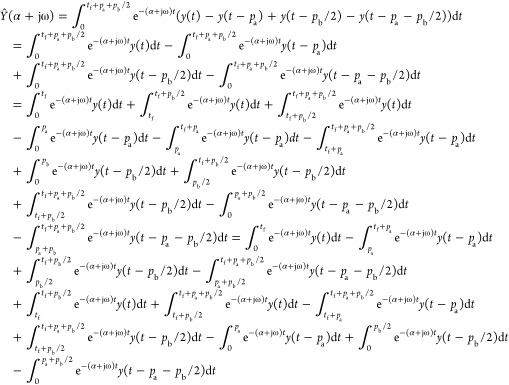 |
A7 |
Terms are rearranged and simplified. The main integrations become
 |
A8 |
As y(t) = −y(t – pb/2) for t > tf + pb/2, integrations after t = tf become
 |
A9 |
As y(t – pb/2) = y(t – pa – pb/2) for t < 0, integrations before t = 0 become
 |
A10 |
The same equations are obtained for Û(α + jω). The proposition 2 follows.
Author Present Address
§ Department of Chemical Engineering, Lehigh University.
The authors declare no competing financial interest.
References
- Åström K. J.; Hägglund T. Automatic tuning of simple regulators with specifications on phase and amplitude margins. Automatica 1984, 20, 5645–5651. 10.1016/0005-1098(84)90014-1. [DOI] [Google Scholar]
- Seborg D. E.; Mellichamp D. A.; Edgar T. F.; Doyle F. J. III. Process Dynamics and Control, 3rd ed.; Wiley: New Jersey, 2011. [Google Scholar]
- Yu C. C.Autotuning of PID Controllers: A Relay Feedback Approach, 2nd ed.; Springer: London, U.K., 2006. [Google Scholar]
- Wang Q. G.; Lee T. H.; Lin C.. Relay Feedback: Analysis, Identification and Control; Springer: London, U.K., 2003. [Google Scholar]
- Chidambaram M.; Sathe V.. Relay Autotuning for Identification and Control; Cambridge University Press: London, U.K., 2014. [Google Scholar]
- Chidambaram M.; Nikita S.. Relay Tuning of PID Controllers: For Unstable MIMO Processes; Springer: London, U.K., 2018. [Google Scholar]
- Hang C. C.; Astrom K. J.; Wang Q. G. Relay feedback auto-tuning of process controllers – a tutorial review. J. Process Control 2002, 12, 143–162. 10.1016/s0959-1524(01)00025-7. [DOI] [Google Scholar]
- Hornsey S. A review of relay auto-tuning methods for the tuning of PID-type controllers. Reinvent. Int. J. Undergrad. Res. 2012, 5, 2. [Google Scholar]
- Liu T.; Wang Q.-G.; Huang H.-P. A tutorial review on process identification from step or relay feedback test. J. Process Control 2013, 23, 1597–1623. 10.1016/j.jprocont.2013.08.003. [DOI] [Google Scholar]
- Berner J.; Hägglund T.; Åström K. J. Asymmetric relay autotuning – Practical features for industrial use. Contr. Eng. Pract. 2016, 54, 231–245. 10.1016/j.conengprac.2016.05.017. [DOI] [Google Scholar]
- Luyben W. L. Getting more information from relay feedback tests. Ind. Eng. Chem. Res. 2001, 40, 4391–4402. 10.1021/ie010142h. [DOI] [Google Scholar]
- Shen S.-H.; Wu J.-S.; Yu C.-C. Use of biased-relay feedback for system identification. AIChE J. 1996, 42, 1174–1180. 10.1002/aic.690420431. [DOI] [Google Scholar]
- Kaya I.; Atherton D. P. Parameter estimation from relay autotuning with asymmetric limit cycle data. J. Process Control 2001, 11, 429–439. 10.1016/s0959-1524(99)00073-6. [DOI] [Google Scholar]
- Panda R. C.; Yu C.-C. Shape factor of relay response curves and its use in autotuning. J. Process Control 2005, 15, 893–906. 10.1016/j.jprocont.2005.02.004. [DOI] [Google Scholar]
- Lee J.; Sung S. W.; Edgar T. F. Integrals of relay feedback responses for extracting process information. AIChE J. 2007, 53, 2329–2338. 10.1002/aic.11256. [DOI] [Google Scholar]
- Co T. Relay-stabilization and bifurcations of unstable SISO processes with time delay. IEEE Trans. Autom. Control 2010, 55, 1131–1141. 10.1109/tac.2010.2045437. [DOI] [Google Scholar]
- Mehta U. Stabilizing relay experiment for modeling of unstable processes with large time delay. J. Syst. Control Eng. 2014, 228, 359–368. 10.1177/0959651814524949. [DOI] [Google Scholar]
- Huang H.-P.; Chen C.-C. Auto-tuning of PID controller for second order unstable process having dead time. J. Chem. Eng. Jpn. 1999, 32, 486–497. 10.1252/jcej.32.486. [DOI] [Google Scholar]
- Liu T.; Gao F. Alternative identification algorithms for obtaining a first-order stable/unstable process model from a single relay feedback test. Ind. Eng. Chem. Res. 2008, 47, 1140–1149. 10.1021/ie070856d. [DOI] [Google Scholar]
- Vivek S.; Chidambaram M. An improved relay auto tuning of PID controllers for unstable FOPTD systems. Comput. Chem. Eng. 2005, 29, 2060–2068. 10.1016/j.compchemeng.2005.05.004. [DOI] [Google Scholar]
- Marchetti G.; Scali C.; Lewin D. R. Identification and control of open-loop unstable processes by relay methods. Automatica 2001, 37, 2049–2055. 10.1016/s0005-1098(01)00181-9. [DOI] [Google Scholar]
- Liu T.; Gao F. Identification of integrating and unstable processes from relay feedback. Comput. Chem. Eng. 2008, 32, 3038–3056. 10.1016/j.compchemeng.2008.04.006. [DOI] [Google Scholar]
- Panda R. C.; Vijayan V.; Sujatha V.; Deepa P.; Manamali D.; Mandal A. B. Parameter estimation of integrating and time delay processes using single relay feedback test. ISA Trans. 2011, 50, 529–537. 10.1016/j.isatra.2011.06.004. [DOI] [PubMed] [Google Scholar]
- Cheon Y. J.; Sung S. W.; Lee J.; Je C. H.; Lee I.-B. Improved frequency response model identification method for processes with initial cyclic-steady-state. AIChE J. 2011, 57, 3429–3435. 10.1002/aic.12550. [DOI] [Google Scholar]
- Kim K.; Cheon Y. J.; Lee I.-B.; Lee J.; Sung S. W. A frequency response identification method for discrete-time processes with cyclic steady state conditions. Automatica 2014, 50, 3260–3267. 10.1016/j.automatica.2014.10.052. [DOI] [Google Scholar]
- Park J. H.; Sung S. W.; Lee I.-B. Improved relay auto-tuning with static load disturbance. Automatica 1997, 33, 711–715. 10.1016/s0005-1098(96)00174-4. [DOI] [Google Scholar]
- Sung S. W.; Lee J.; Lee D. H.; Han J. H.; Park Y. S. Two-channel relay feedback method under static disturbances. Ind. Eng. Chem. Res. 2006, 45, 4071–4074. 10.1021/ie0513393. [DOI] [Google Scholar]
- Hofreiter M. Shifting method for relay feedback identification and control of delayed sytems. WSEAS Trans. Syst. 2016, 15, 39–48. [Google Scholar]
- Cho W.; Lee J.; Edgar T. F. Simple analytic proportional-integral-derivative (PID) controller tuning rules for unstable processes. Ind. Eng. Chem. Res. 2014, 53, 5048–5054. 10.1021/ie401018g. [DOI] [Google Scholar]
- Skogestad S. Simple analytic rules for model reduction and PID controller tuning. J. Process Control 2003, 13, 291–309. 10.1016/s0959-1524(02)00062-8. [DOI] [Google Scholar]
- Lee J.; Cho W.; Edgar T. F. Simple analytic PID controller tuning rules revisited. Ind. Eng. Chem. Res. 2014, 53, 5038–5047. 10.1021/ie4009919. [DOI] [Google Scholar]
- Park J. H.; Sung S. W.; Lee I.-B. An enhanced PID control strategy for unstable processes. Automatica 1998, 34, 751–756. 10.1016/s0005-1098(97)00235-5. [DOI] [Google Scholar]
- Majhi S.; Atherton D. P. Online tuning of controllers for an unstable FOPTD process. IEE Proc. Control Theory Appl. 2000, 147, 421–427. 10.1049/ip-cta:20000245. [DOI] [Google Scholar]


