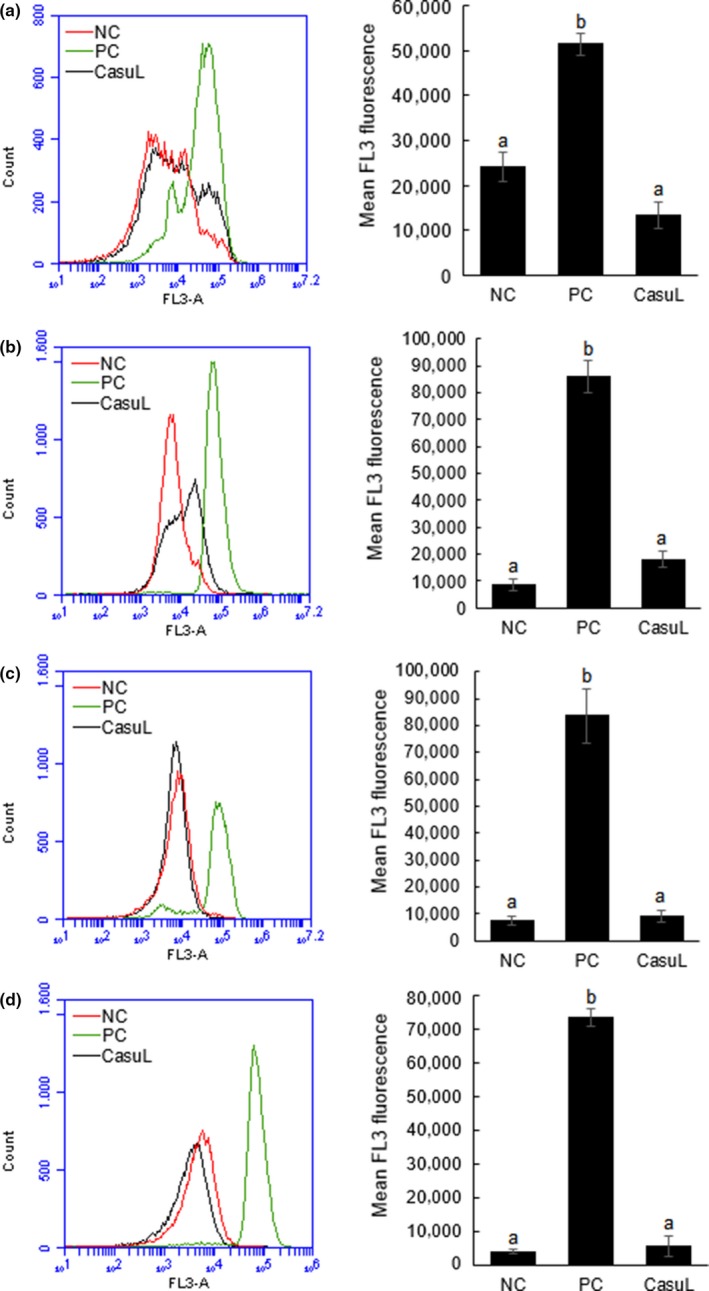
Figure 4.

Analysis of cell viability of the isolates Ssp01 (a), Ssp5D (b), Ssp6PD (c), and Sa (d) in absence or presence of CasuL at the minimal inhibitory concentration (MIC) by flow cytometry. Cells incubated in absence of lectin corresponded to the negative control (NC). Isopropyl alcohol (70%, v/v) was used as positive control (PC). Overlay histograms (at left) shows the distribution of unviable cells stained with propidium iodide (FL3 channel) in NC, PC and CasuL groups. Bar charts (at right) display the mean fluorescence in FL3 channel. Data are expressed as the mean ± SD. All the MIC values are given in Table 1
