Figure 2.

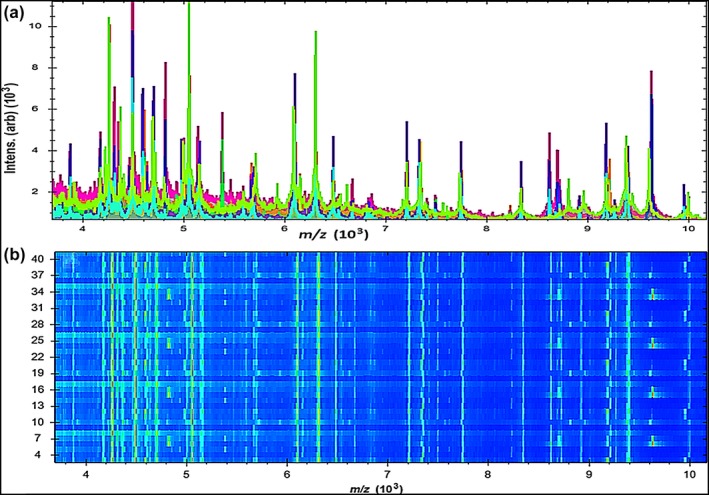
Mass spectral profiles of 43 Aeromonas spp.; (a) higher strength peaks were scattered within the line spectra ranging from 4,000 to 10,000 Da; (b) The gel profile of protein spectra distributed within the same range

Mass spectral profiles of 43 Aeromonas spp.; (a) higher strength peaks were scattered within the line spectra ranging from 4,000 to 10,000 Da; (b) The gel profile of protein spectra distributed within the same range