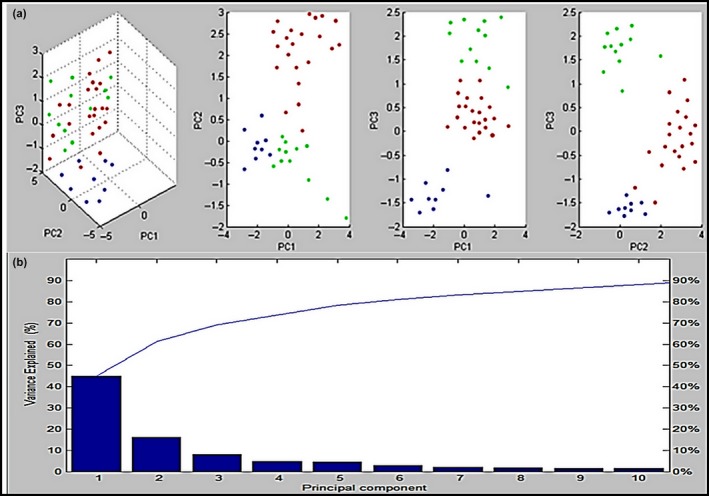
Figure 3.

The dimensional image from PCA displays the difference between 43 Aeromonas spp.; (a) the grouping of A. hydrophila (red), A. caviae (green), and A. sobria (blue) in the first three model of PC (PC1, PC2, PC3); (b) the influence of ten principal components to the profiling classification in plot of percentage explained variance of PC. The contributions of PC1, PC2, and PC3 were around 45%, 17%, and 9%, correspondingly
