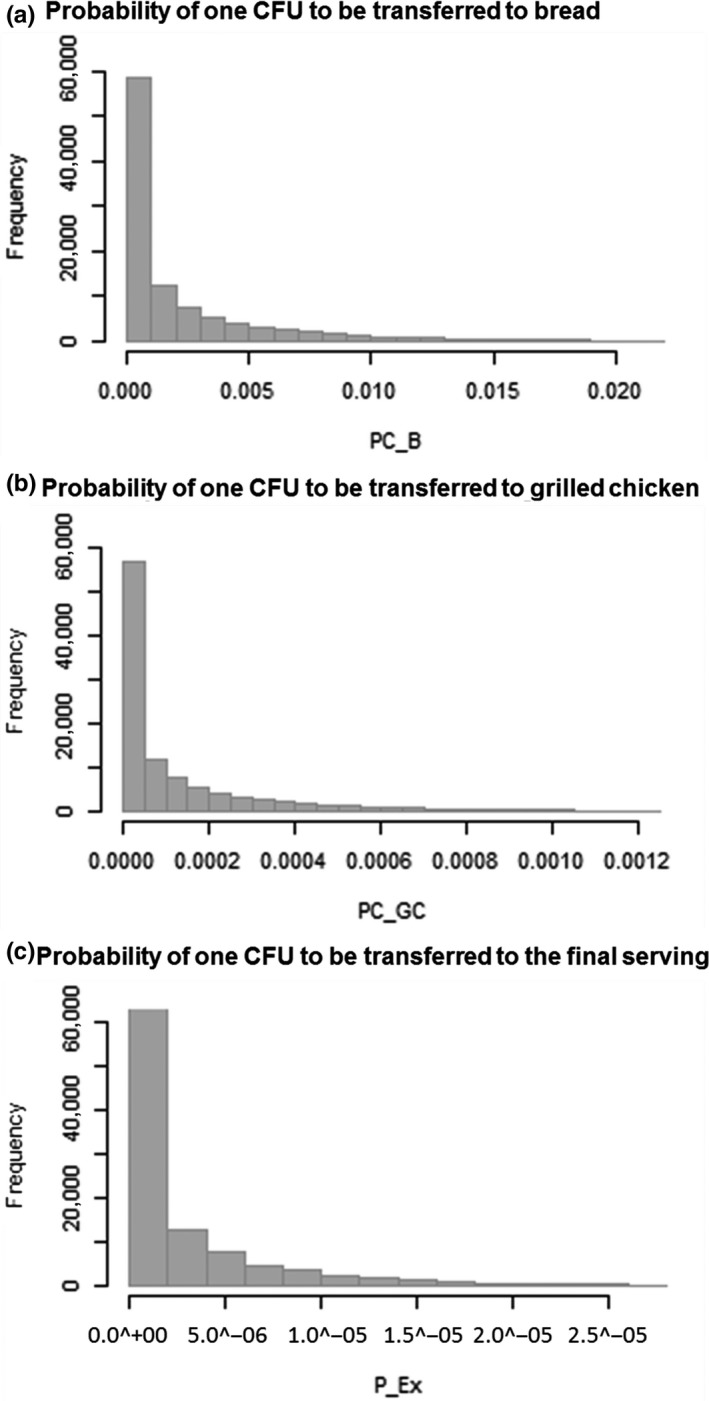
Figure 2.

Model output from a series of 105 Monte Carlo simulations of the model, showing the relative frequencies of the probabilities of one CFU to be transferred to (a) bread (PC_B), (b) grilled chicken (PC_GC), and (c) the final serving (P_Ex) due to the cross‐contamination and recontamination events contemplated in the model
