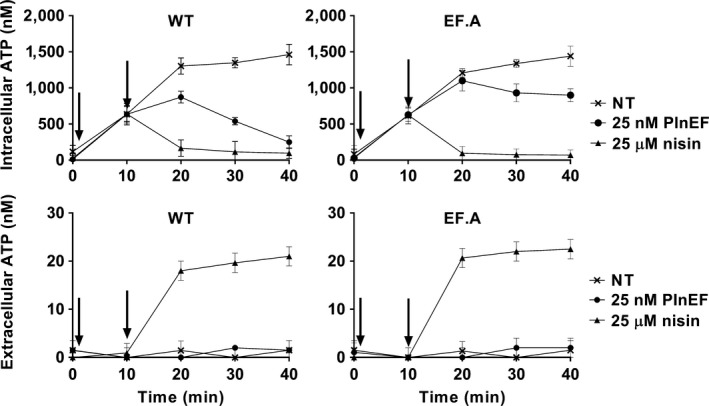
Figure 2.

Effects of plantaricin EF (PlnEF) on cellular concentrations of ATP. Cells of LP965 and the PlnEF‐resistant isolate EF.A were initially energized with 10 mM glucose (arrow at 1 min). At 10 min (second arrow), 25 nM of PlnEF, 25 μM nisin, or water (NT) was added to each culture. The avg ± SD of n = 3 replicates is shown
