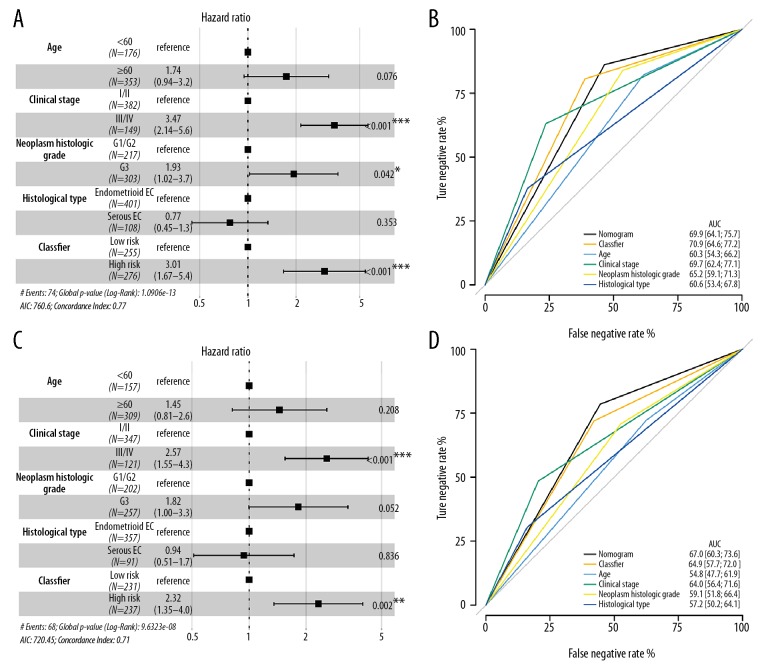
Figure 6.
Multivariate analyses. (A, C) A hazard ratio of enrolled clinicopathological features and the miRNA-based OS/RFS classifiers in the overall set, respectively. (B, D) ROC curve showed the difference between clinicopathological features and the miRNA-based OS/RFS classifiers in the overall set, respectively. Nomogram was a synthesis model by combining the miRNA-based overall survival classifier and clinicopathological features. miRNA – microRNA; OS – overall survival; RFS – recurrence-free survival; AUC – area under the curve; ROC – receiver operating characteristic.

