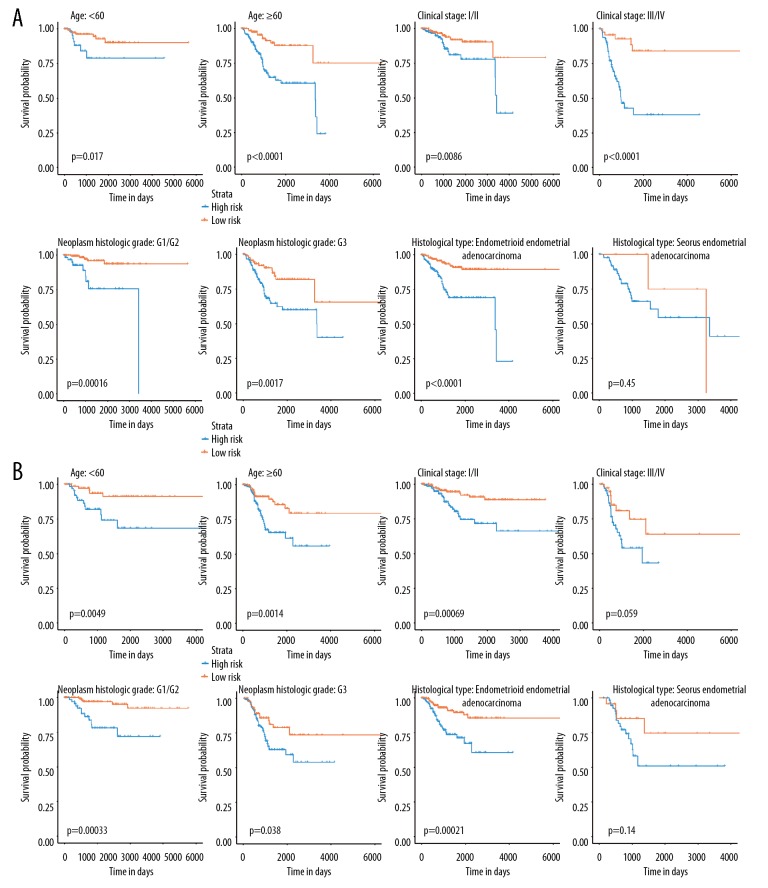
Figure 7.
Subgroup analyses revealed by Kaplan-Meier survival curve. (A) Stratified survival analyses based on the clinicopathological features age, clinical stage, histological stage, and neoplasm histological grade for the 7-miRNA-based OS classifier. (B) Stratified survival analyses based on the clinicopathological features age, clinical stage, histological stage, and neoplasm histological grade for the seven-miRNA-based RFS classifier. The blue line suggested the high-risk group, while the yellow line indicated the low-risk group. miRNA – microRNA; OS – overall survival; RFS – recurrence-free survival.

