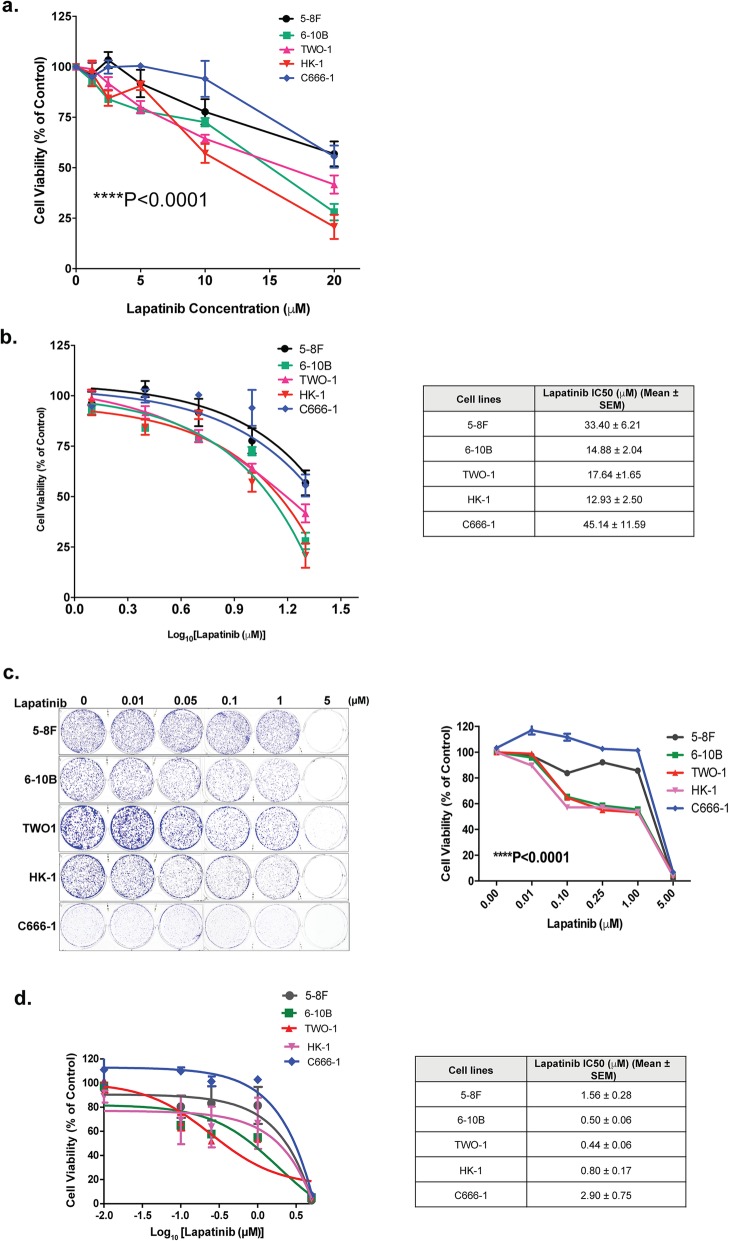
Fig. 1.
Effects of Lapatinib on cell growth and proliferation of NPC cells. a Lapatinib sensitivity curves in NPC cells was determined by sulforhodamine B staining. Cells (3 × 10³ / well) were seeded in 96-well plates and treated with increasing concentrations of Lapatinib for 72 h before SRB staining and measurement of optical density at 492 nm. b Best-fit curves were generated to determine IC50 for each NPC cell lines against Lapatinib. c NPC cells were seeded into 6-well plates (1 × 10³ cells / well) and treated with Lapatinib for 72 h. Colony formation was monitored after 15 days, stained with crystal violet (representative images are shown) and absorbance at 592 nm determined (right panel). d Best-fit curves were generated to determine IC50 for each NPC cells against Lapatinib in terms of clonogenic assay. Numerical data represent the average ± SEM of three independent experiments (**** P < 0.0001)

