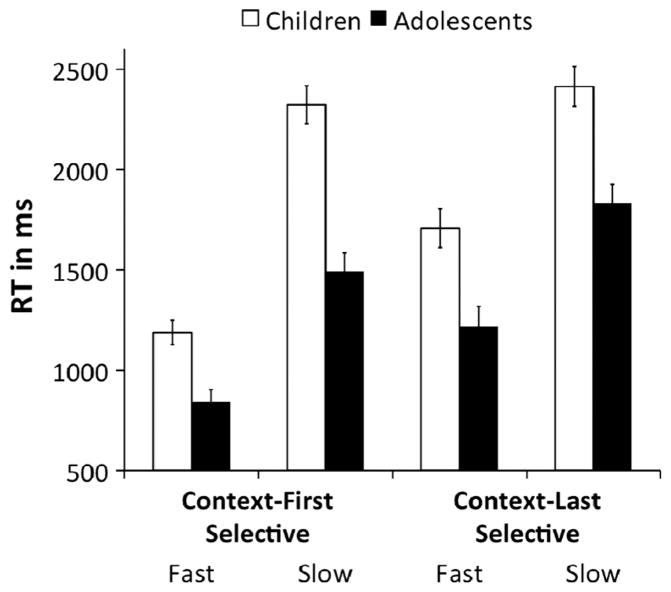
Fig. 5.
Bars plot mean RT for the proactive vs. reactive distributions as a function of condition (context first-selective [CF-S]/context last-selective [CL-S]) and age group (children/adolescents). Greater slowing for children relative to adolescents is evident for reactive versus proactive distributions in context first-selective relative to context last-selective. Error bars plot standard error of the mean.

