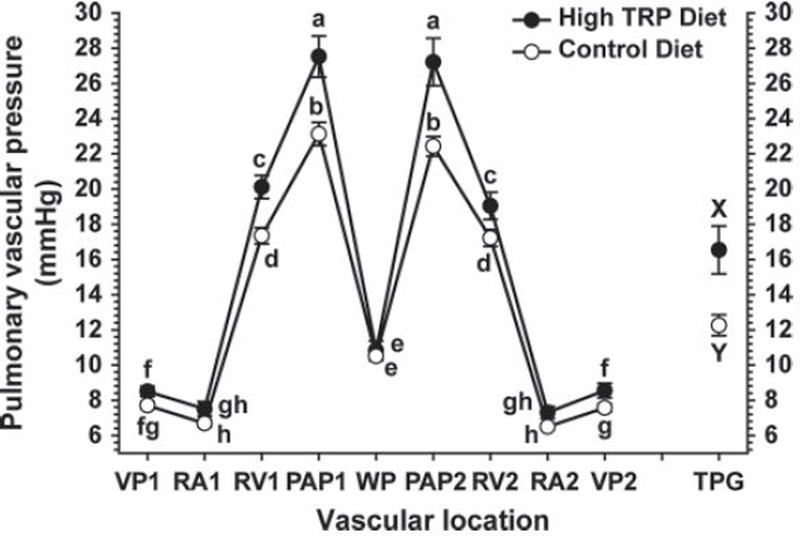
Figure 3.
Pulmonary vascular pressure profiles for the control (n = 16) and high-Trp (n = 16) groups. Pressures (mmHg) were recorded as a catheter was advanced through the basilica vein (VP1), into the right atrium (RA1), right ventricle (RV1), and pulmonary artery (PAP1), until the wedge pressure (WP) was obtained. Vascular pressures were also recorded as the catheter was withdrawn (PAP2, RV2, RA2, and VP2). The transpulmonary pressure gradient (TPG) was calculated as PAP − WP. a–hValues with different letters differed significantly (P < 0.05).

