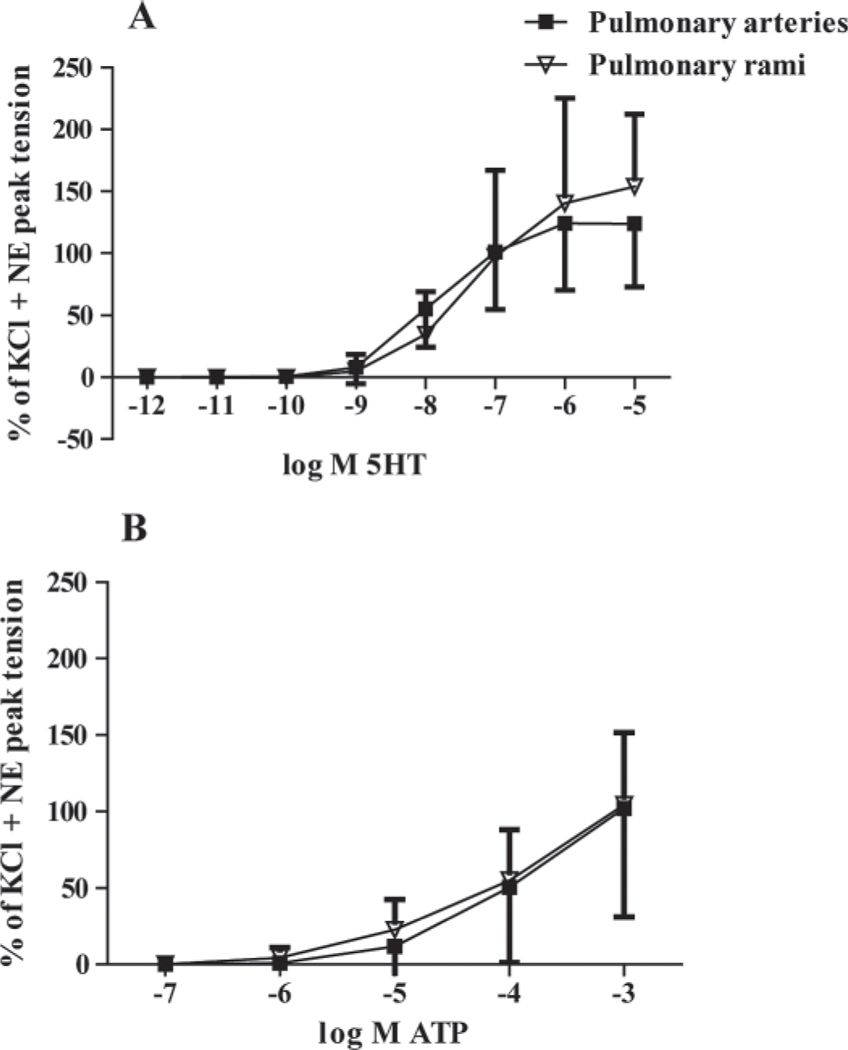
Figure 6.
Comparison of the agonist response curve in the pulmonary arteries versus the pulmonary rami. Diet groups are combined because there was no diet-group effect. Serotonin (5HT)-mediated vasoconstriction (A) was not different in pulmonary rami (n = 19) and pulmonary arteries (n = 20). The addition of adenosine triphosphate (ATP) produced an increase in relative tension in the pulmonary artery and rami (B). NE = norepinephrine.

