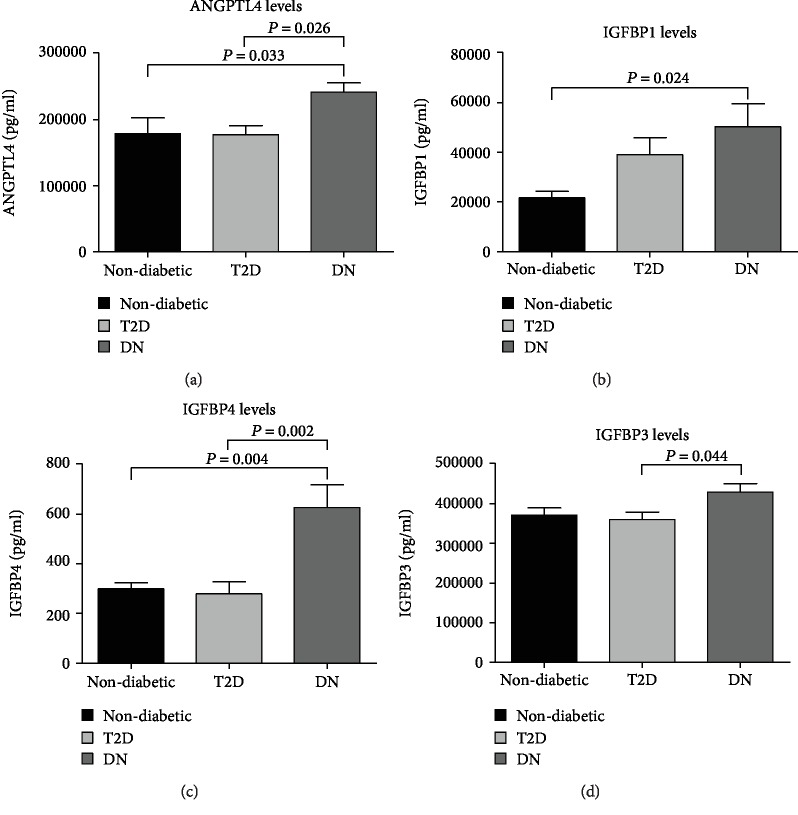
Figure 1.
Fasting plasma levels of ANGPTL4, IGFBP1, IGFBP4, and IGFBP3 in all populations. (a) Comparing levels of ANGPTL4 between all study groups: nondiabetic control, T2D, and DN. (b) Comparing levels of IGFBP1 between control, T2D, and DN patients. (c) Comparing IGFBP4 levels between control, T2D, and DN patients. (d) Comparing IGFBP3 levels between control, T2D, and DN patients.

