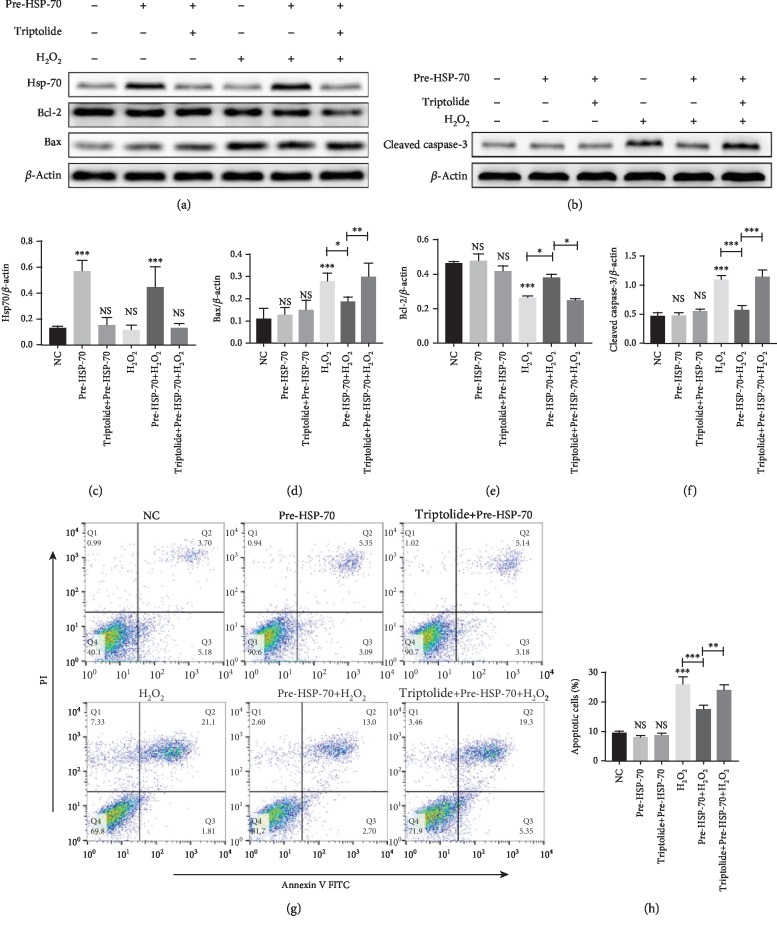
Figure 6.
Antiapoptotic effects of HSP-70 in vitro. (a–f) Representative western blot images showing the protein levels of HSP-70, Bcl-2, Bax, and cleaved caspase-3. β-Actin was used as an internal control. (g) Representative dot plots of cell apoptosis were showed after Annexin V/PI dual staining. (h) The percentage of apoptotic cells was represented for both early and late apoptotic cells. Every experiment was repeated at least three times. Error bars indicate mean ± SD (∗P < 0.05; ∗∗P < 0.01; ∗∗∗P < 0.001).

