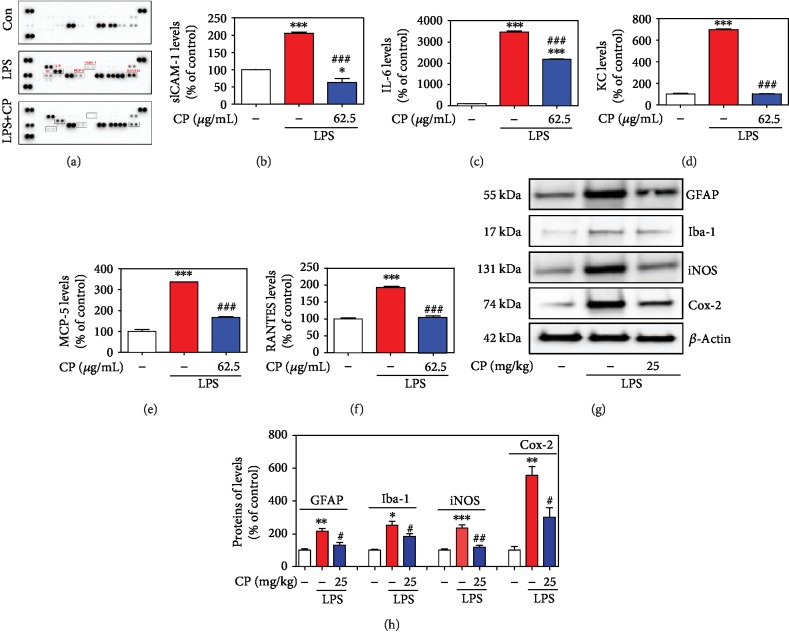
Figure 9.
Effects of CP on LPS-induced neuroinflammatory signaling factors. Microglial BV2 cells were treated with CP for 2 h and with LPS for an additional 22 h. After 24 h incubation, the cultures were subjected to a cytokine antibody array assay (h). Densitometric ratios of the arrays showed differences in the cytokine markers (ICAM-1, KC, IL-6, MCP-5, and RANTES) (i–m). The glial activation markers (GFAP and Iba-1) and neuroinflammatory signaling factors (iNOS and Cox-2) were measured using western blotting (n). Bar graphs represent the relative expression of GFAP, Iba-1, iNOS, and Cox-2 (o) for (n). Values shown represent means ± S.E.M. ∗p < 0.05, ∗∗p < 0.01, and ∗∗∗p < 0.001 compared with the control group and #p < 0.05, ##p < 0.01, and ###p < 0.001 compared with the LPS-treated group.

