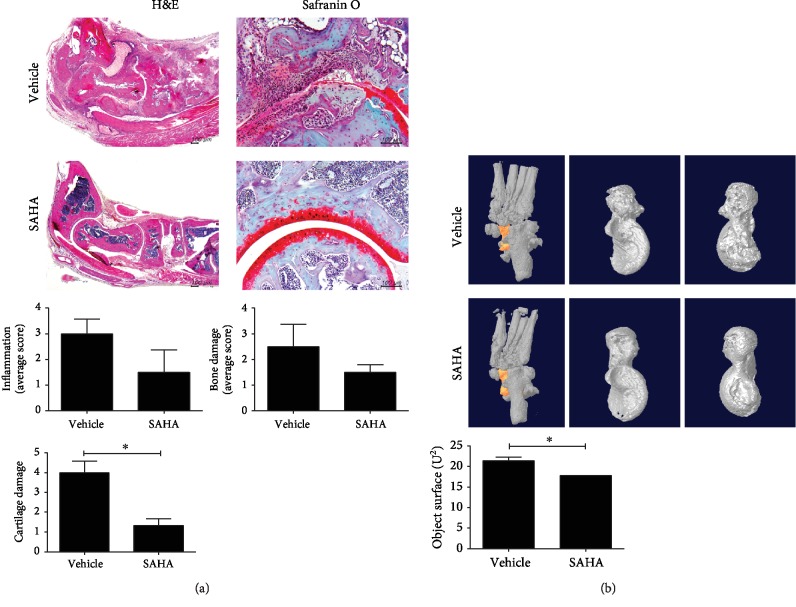
Figure 2.
Effects of SAHA on joint inflammation in CIA mice. (a) Histological analysis of joint tissue sections with H&E (original magnification, 40x) and safranin O (original magnification, 200x). Joint inflammation and damage scores are shown (n = 3). (b) Representative micro-CT appearances of the joints at 8 weeks after CIA induction. The position of the talus in the joint and a representative picture of the talus in two directions. Objective surface of micro-CT images from joints is shown (n = 3). ∗p < 0.05.

