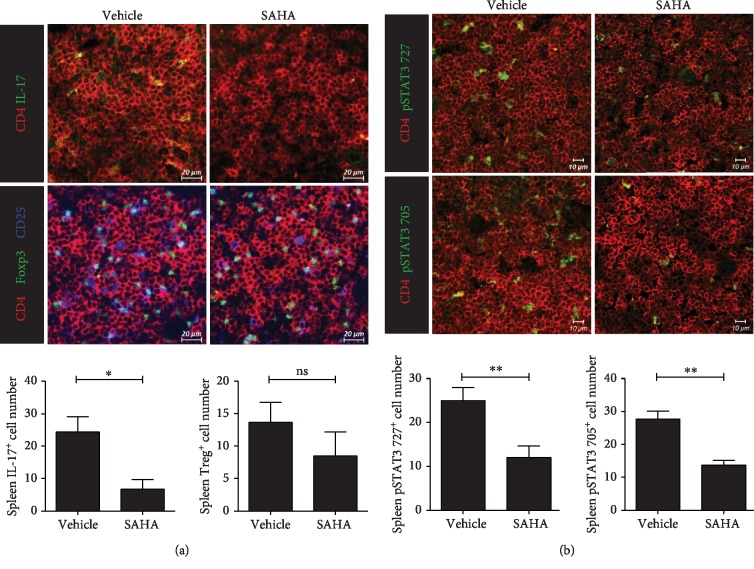
Figure 4.
Effects of SAHA on T cells in ex vivo spleen tissue. (a) Confocal microscopy of spleen cryosections, stained for Th17 or Treg cells. The numbers of positive cells are shown (n = 3). (b) Confocal microscopy of spleen cryosections, stained for pSTAT3 727 or pSTAT3 705 (original magnification, 400x). The numbers of positive cells are shown (n = 3). ∗p < 0.05 and ∗∗p < 0.01.

