
Figure 3.
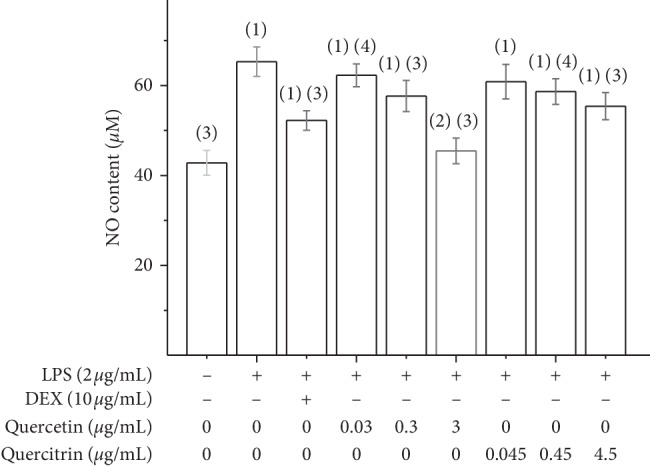
The effect of quercetin and quercitrin of NO content on RAW264.7 cells induced by LPS, ± s (n = 3). (1)P < 0.01; (2)P < 0.05, compared with control group; (3)P < 0.01; (4)P < 0.05, compared with LPS group.
Official websites use .gov
A
.gov website belongs to an official
government organization in the United States.
Secure .gov websites use HTTPS
A lock (
) or https:// means you've safely
connected to the .gov website. Share sensitive
information only on official, secure websites.
The effect of quercetin and quercitrin of NO content on RAW264.7 cells induced by LPS, ± s (n = 3). (1)P < 0.01; (2)P < 0.05, compared with control group; (3)P < 0.01; (4)P < 0.05, compared with LPS group.