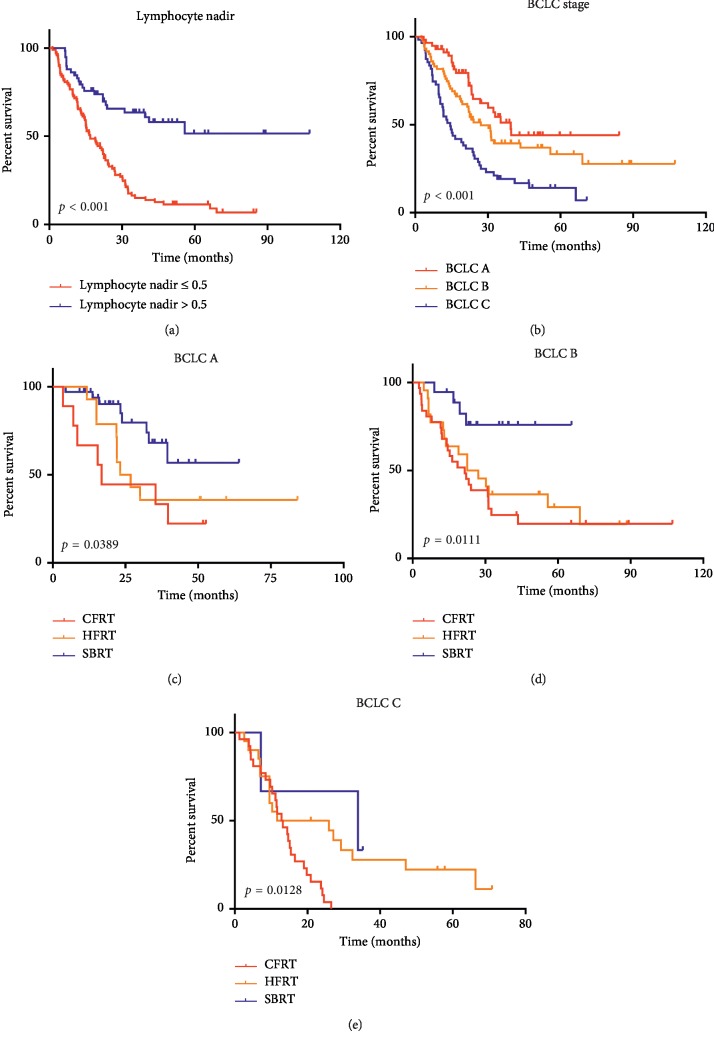
Figure 4.
Survival curves according to independent prognostic factors of patients with HCC treated with RT (a). Patient survival analysis based on lymphocyte nadir, p < 0.001 (b). Patient survival analysis based on BCLC stage, p < 0.001, and stratified analyses based on BCLC stage A p=0.0389 (c). BCLC stage B, p=0.0111 (d). BCLC stage C, p=0.0128 (e).

