Figure 3.
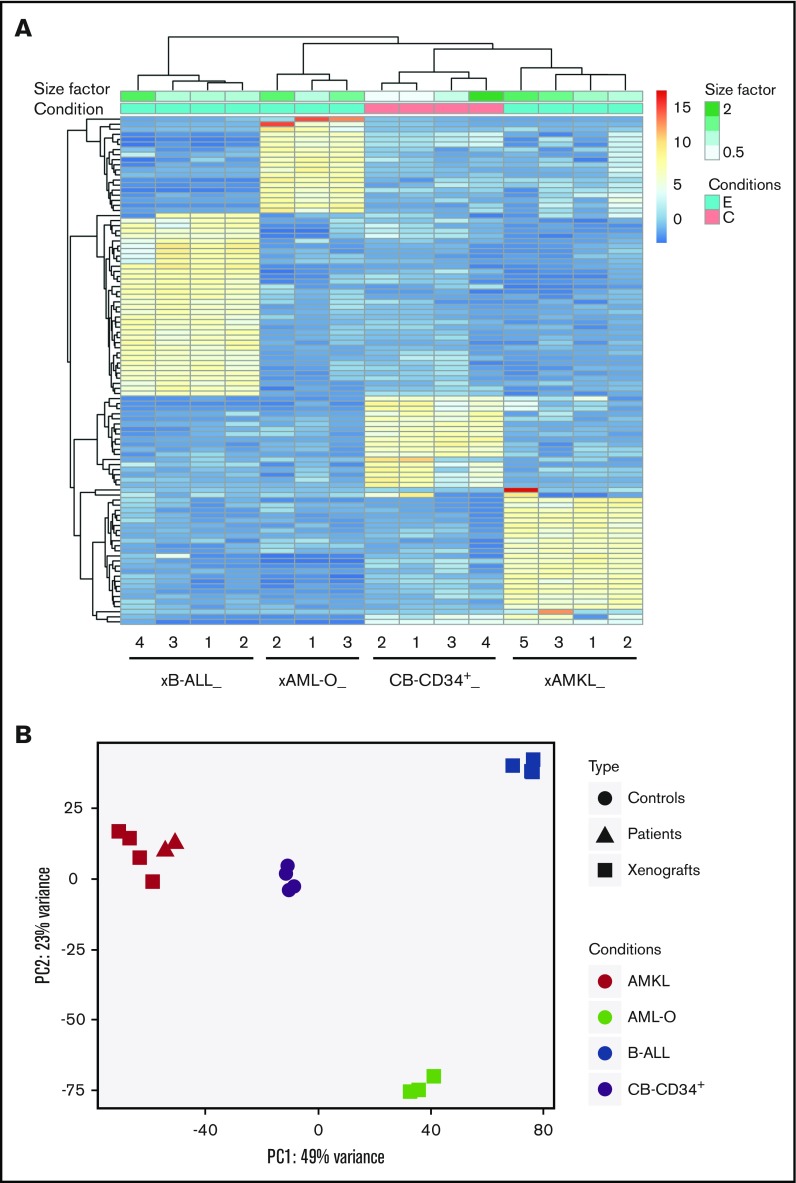
Distinct expression profiles of NUP98-KDM5A leukemia subtypes compared with normal CB CD34+cells. (A) Hierarchical clustering heat map of the top 100 genes differentially expressed between the 3 leukemia subtypes observed in N5A xenograft models (AMKL xenograft [xAMKL], n = 4; B-ALL xenograft [xB-ALL], n = 4; AML-O xenograft [xAML-O], n = 3) and normal CB CD34+ cells (CB-CD34+ cells, n = 4). Read count data were converted into log2 values and represented according to a blue-yellow-red–colored gradient scale. The size factor values, reflecting the correction factor for normalization of the relative depth of sample libraries, are represented by a gradient of green tones according to the size factor scale bar. Sample conditions are described by a binary (pink, C/control; blue, E/experimental leukemia) color code. (B) Principal component analysis plots of the first and second principal components of NUP98-KDM5A models, patients, and controls, calculated using the 500 most variable genes between all conditions.

