Figure 5.
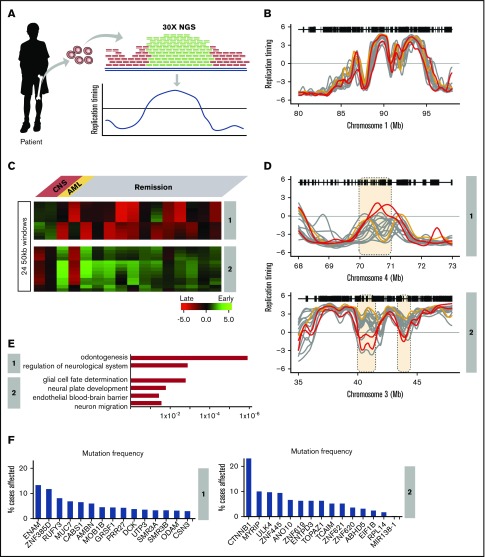
RT signatures linked to CNS relapse of TCF3-PBX1–positive BCP-ALL patients. (A) Patient samples were subjected to WGS at 28× depth. These sequences were subjected to a pipeline that converts their relative copy number into RT profiles.20 WGS data for 21 patients were obtained and the 16 with highest-quality RT profiles (based on genome-wide correlations to each other; supplemental Figure 4) were chosen for analysis. Of these, 2 samples were from patients who later suffered CNS relapse, and 1 was from a patient who developed a secondary AML; the remaining samples were from patients who were in remission. (B) Exemplary profiles of all patient samples from a typical genomic region that shows no variance between sample profiles. (C) Clustering analysis of differences between relapses vs remission. Two RT signatures distinguish patients who developed CNS relapse from those in remission. (D) RT profiles of each signature shown in panel C. (E) Ontology analysis of RT signatures shown in panel C. (F) Mutation frequencies for the genes in the RT signatures shown in panel C. Mutation frequencies were obtained from the National Cancer Institute Genomic Data Commons Data Portal.45

