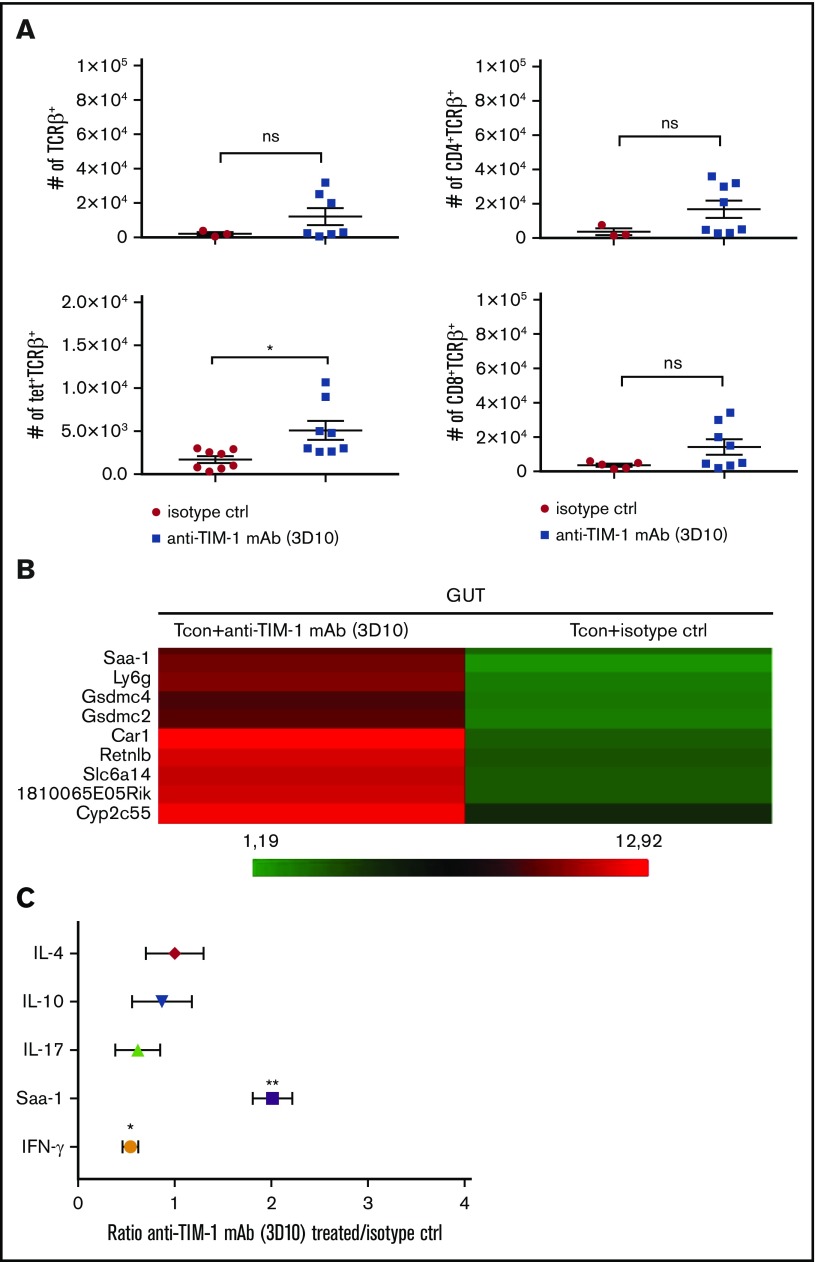
Figure 7.
Treatment with anti–TIM-1 blocking mAb reduced inflammatory factors and infiltrating cells in the gut following HCT. (A) Absolute numbers of CD4+TCRβ+, CD8+TCRβ+, tet+TCRβ+, and CD4+CD25+Foxp3+ cells isolated at day 9 after transplantation from the gut of BALB/c recipient mice treated with isotype control (●) or anti–TIM-1 mAb (3D10) (▪). PBS-57–loaded murine CD1d tetramer was used to identify iNKT cells. Pooled data from 2 independent experiments are shown (n = 8 per group). For statistical analysis, the 2-tailed Student t test was used (*P ≤ .05). Error bars indicate SEM. (B) Microarray heatmap of whole gut cells isolated at day 9 after transplantation from BALB/c recipient mice treated with isotype control or anti–TIM-1 mAb (3D10). Representative results from 2 independent analyses are shown. Red indicates upregulated genes, and green indicates downregulated genes. Genes of interested are indicated. (C) IL-17, IL-10, IL-4, IFN-γ, and Saa-1 mRNA levels were assessed by qRT-PCR on whole cells isolated at day 9 after transplantation from gut of BALB/c recipient mice treated with isotype control or anti–TIM-1 mAb (3D10). The x-axis represents the ratio of TIM-1 to isotype control of relative gene expression normalized to the BM control. Shown are representative results in triplicate from 2 independent experiments. For statistical analysis, the 2-tailed Student t test was used (*P ≤ .05, **P ≤ .01).

