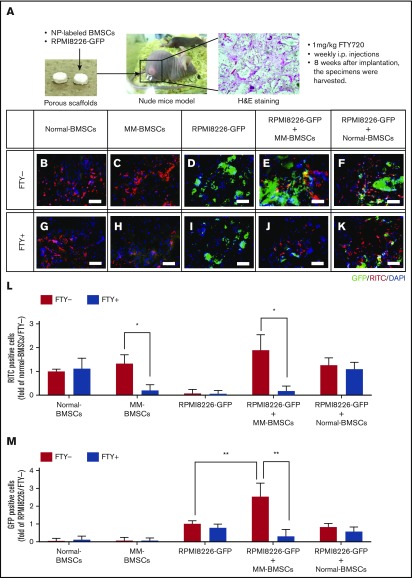
Figure 6.
FTY720 indirectly and directly inhibited the proliferation of MM cells in vivo. (A) Schematic of in vivo 3-dimensional coculture model. Scale bars, 1 µm. (B-K) Fluorescence microscopic examination of RITC+ cells (nanoparticle-labeled BMSCs; red) and GFP+ cells (RPMI 8226-GFP; green) 8 weeks after implantation of scaffolds impregnated with normal-BMSCs (B,G), MM-BMSCs (C,H), RPMI 8226–GFP (D,I), RPMI 8226–GFP+ MM-BMSCs (E,J), and RPMI 8226–GFP+ normal-BMSCs (F,K). Nuclear counterstaining was performed by using DAPI (blue). Scale bars, 200 µm. (L) Quantitative data for RITC+ cells in the scaffold determined according to pixel density. *P < .01 (Student t test). Values are mean ± standard deviation. (M) Quantitative data for GFP+ cells in the scaffold determined according to pixel density. **P < .001 (Student t test). Values are mean ± standard deviation. FTY+, mice treated with 1 mg/kg of FTY720; FTY−, mice without FTY720; H&E, hematoxylin and eosin.

