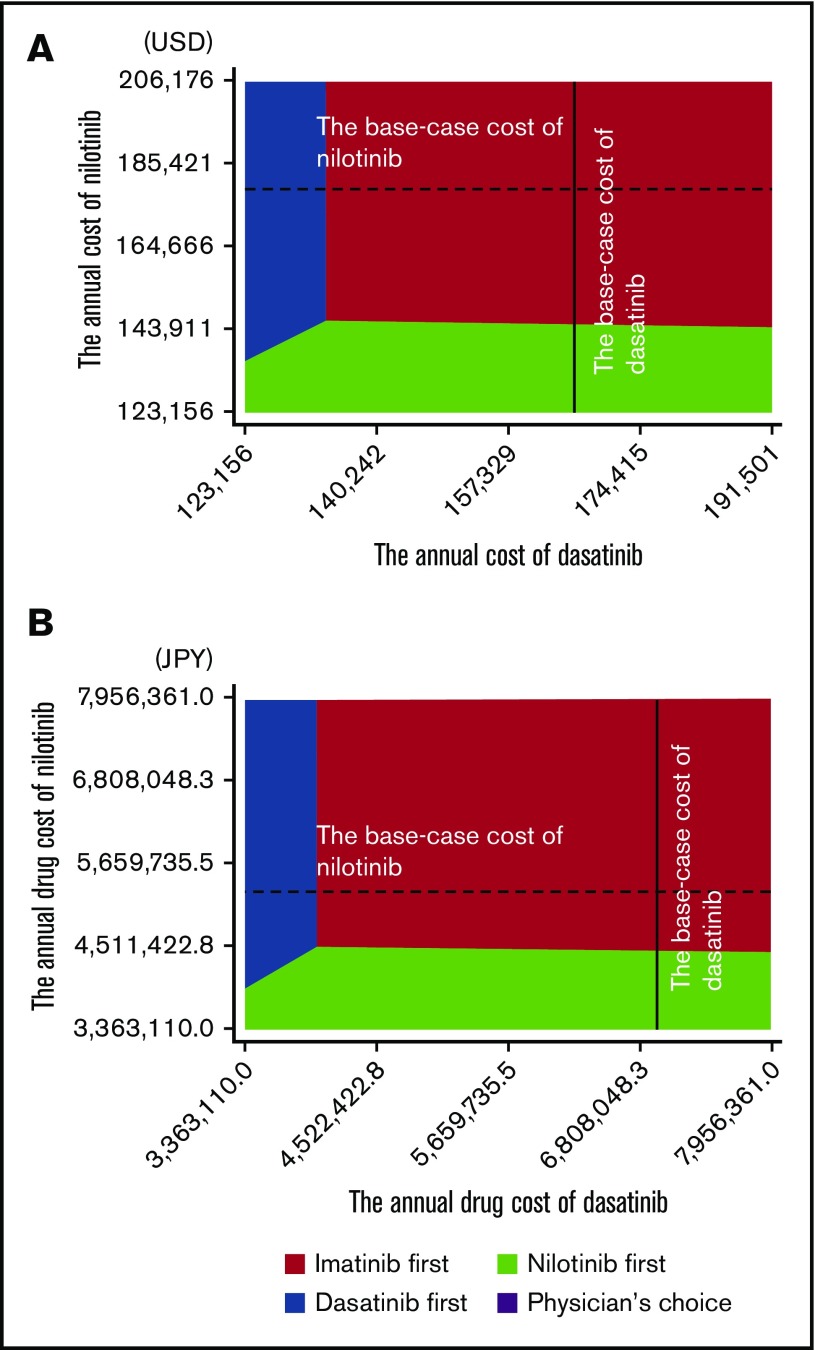
Figure 4.
Two-way sensitivity analysis varying the cost of nilotinib and dasatinib. United States (A) and Japan (B). The colored area indicates the range in which the strategy dominates others. Broken lines indicate the base-case cost of nilotinib; solid lines indicate the base-case cost of dasatinib.

